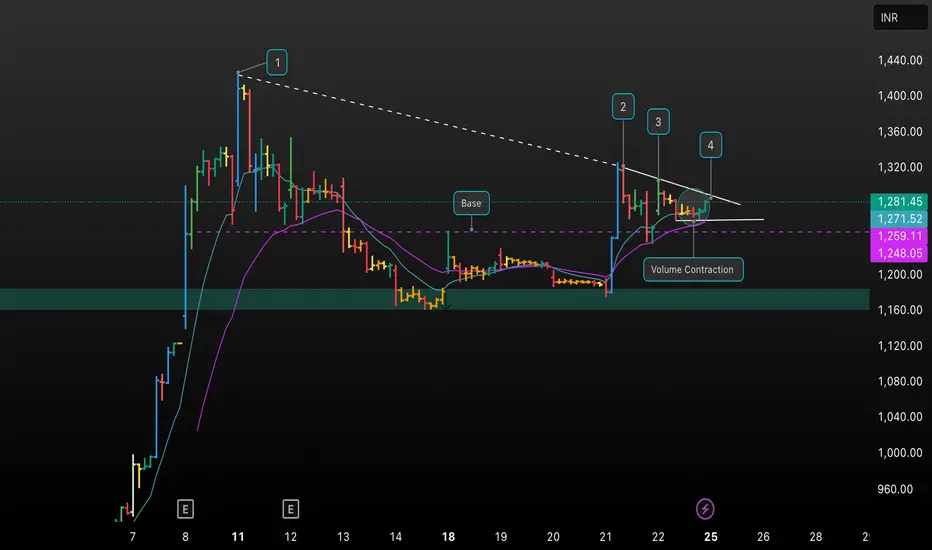
This chart showcases a detailed technical analysis of NSDL on the 45m timeframe, highlighting key price action zones, trendlines, and volume contraction patterns. I’ve marked the base formation, breakout attempts, and areas of interest using numbered points and indicator overlays. Notice the distinct volume contraction phase as price consolidates near resistance, potentially setting up a breakout. Key support/resistance levels and moving averages are also plotted.
Your feedback on this setup or alternative charting perspectives is welcome! Let’s discuss the probabilities and potential trade management for this breakout scenario.
This combination is clear, educational, and designed to invite discussion and engagement from traders and learners.
Your feedback on this setup or alternative charting perspectives is welcome! Let’s discuss the probabilities and potential trade management for this breakout scenario.
This combination is clear, educational, and designed to invite discussion and engagement from traders and learners.
免責事項
これらの情報および投稿は、TradingViewが提供または保証する金融、投資、取引、またはその他の種類のアドバイスや推奨を意図したものではなく、またそのようなものでもありません。詳しくは利用規約をご覧ください。
免責事項
これらの情報および投稿は、TradingViewが提供または保証する金融、投資、取引、またはその他の種類のアドバイスや推奨を意図したものではなく、またそのようなものでもありません。詳しくは利用規約をご覧ください。