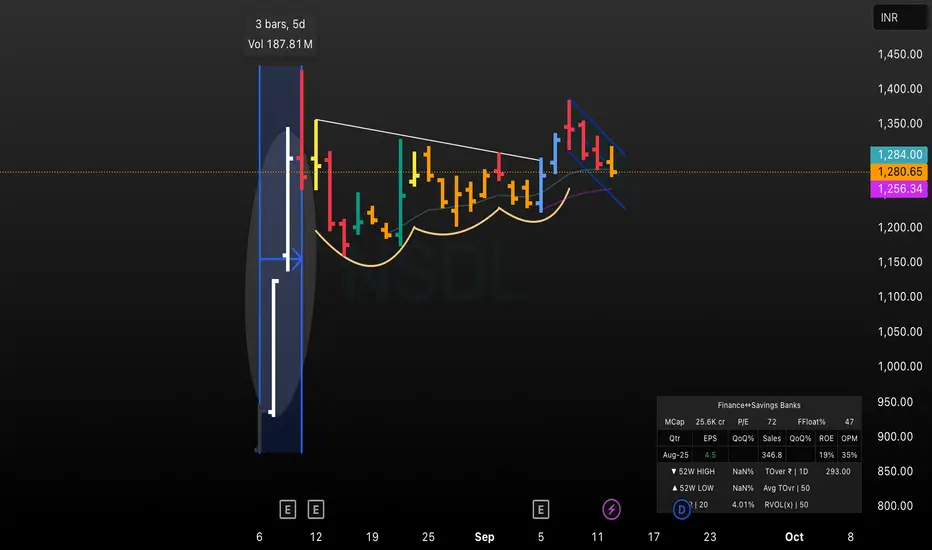
This chart highlights NSDL’s sharp volatility spike (high-volume move) followed by base formation. After explosive price action, the stock began forming higher lows, indicating accumulation. Recent price action shows a bullish setup with contracting ranges, suggesting a possible breakout above resistance. Tracking volume and price structure for next trade move is key.
免責事項
これらの情報および投稿は、TradingViewが提供または保証する金融、投資、取引、またはその他の種類のアドバイスや推奨を意図したものではなく、またそのようなものでもありません。詳しくは利用規約をご覧ください。
免責事項
これらの情報および投稿は、TradingViewが提供または保証する金融、投資、取引、またはその他の種類のアドバイスや推奨を意図したものではなく、またそのようなものでもありません。詳しくは利用規約をご覧ください。