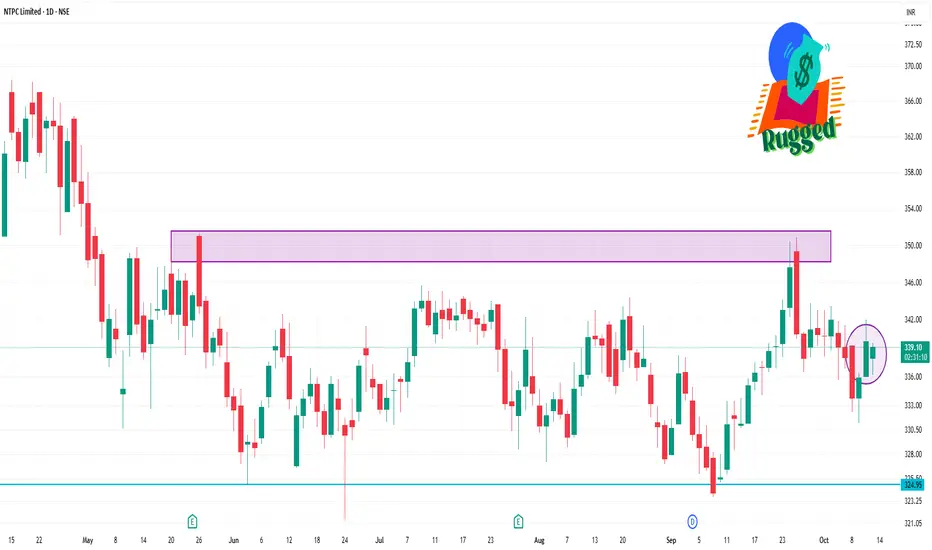
📈 Intraday Support & Resistance Levels
Immediate Support: ₹337.29
Immediate Resistance: ₹340.85
Key Pivot Point: ₹339.20
These levels are derived from standard pivot point calculations and are commonly used by traders for short-term strategies.
🔍 Technical Indicators
Relative Strength Index (RSI): 53.93 — indicating a neutral market condition.
Moving Average Convergence Divergence (MACD): 0.330 — suggesting a bullish trend.
5-Day Moving Average: ₹338.45 — supporting a bullish outlook.
50-Day Moving Average: ₹338.05 — reinforcing the bullish trend.
200-Day Moving Average: ₹336.12 — indicating long-term bullish sentiment.
関連の投稿
免責事項
この情報および投稿は、TradingViewが提供または推奨する金融、投資、トレード、その他のアドバイスや推奨を意図するものではなく、それらを構成するものでもありません。詳細は利用規約をご覧ください。
関連の投稿
免責事項
この情報および投稿は、TradingViewが提供または推奨する金融、投資、トレード、その他のアドバイスや推奨を意図するものではなく、それらを構成するものでもありません。詳細は利用規約をご覧ください。