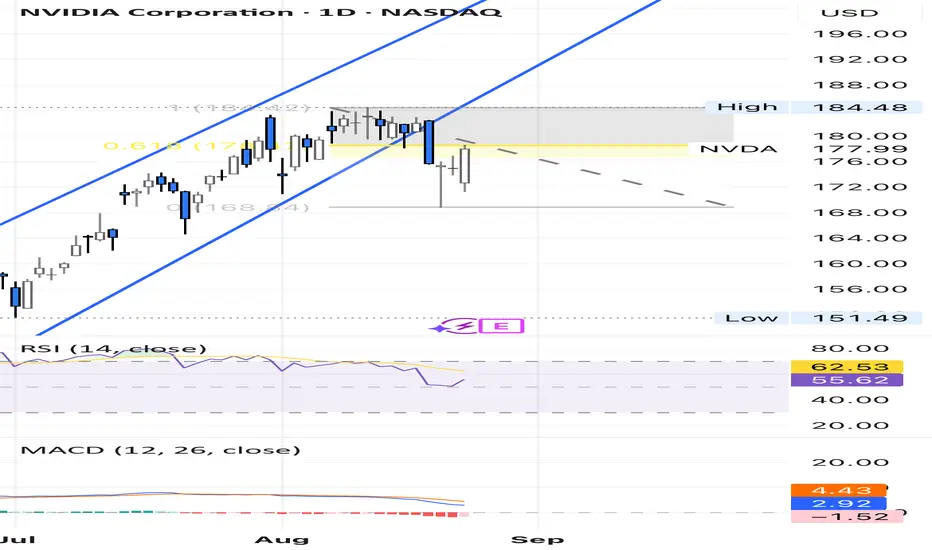
An analysis of Nvidia's price action shows it trading within a four-month-long ascending channel. The price has recently broken below the channel's support line and has since retraced to a key Fibonacci level. This price action, combined with bearish indicators from the MACD and RSI on the daily and weekly charts, presents a technical case for a potential trend reversal.
免責事項
この情報および投稿は、TradingViewが提供または推奨する金融、投資、トレード、その他のアドバイスや推奨を意図するものではなく、それらを構成するものでもありません。詳細は利用規約をご覧ください。
免責事項
この情報および投稿は、TradingViewが提供または推奨する金融、投資、トレード、その他のアドバイスや推奨を意図するものではなく、それらを構成するものでもありません。詳細は利用規約をご覧ください。