NVIDIA (NVDA) – Daily Analysis
The chart is showing something interesting here:
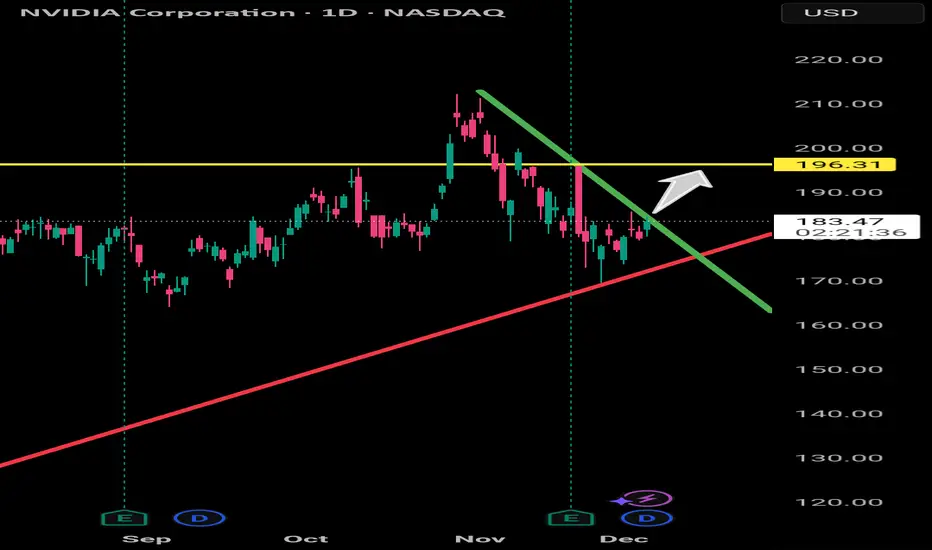
Price has been trending down under the green bearish trendline, but we’re now seeing bullish pressure building right on top of the red long-term bullish trendline.
This creates a compression zone — and usually, NVIDIA doesn’t stay quiet in these zones for long.
What’s the key idea?
If price breaks and closes above the green trendline, momentum can shift bullish again, and the next logical magnet is the yellow horizontal level at 196.31.
Why that level?
It’s a major historical reaction zone.
It aligns as a clean liquidity pool.
Market loves to revisit these "00-zones" and round-number clusters.
Probability Outlook
With current price basing at 183.59 and respecting the bullish diagonal:
➡️ A move toward the yellow line (196.31) is highly probable once the trendline break is confirmed.
The chart is showing something interesting here:
Price has been trending down under the green bearish trendline, but we’re now seeing bullish pressure building right on top of the red long-term bullish trendline.
This creates a compression zone — and usually, NVIDIA doesn’t stay quiet in these zones for long.
What’s the key idea?
If price breaks and closes above the green trendline, momentum can shift bullish again, and the next logical magnet is the yellow horizontal level at 196.31.
Why that level?
It’s a major historical reaction zone.
It aligns as a clean liquidity pool.
Market loves to revisit these "00-zones" and round-number clusters.
Probability Outlook
With current price basing at 183.59 and respecting the bullish diagonal:
➡️ A move toward the yellow line (196.31) is highly probable once the trendline break is confirmed.
免責事項
この情報および投稿は、TradingViewが提供または推奨する金融、投資、トレード、その他のアドバイスや推奨を意図するものではなく、それらを構成するものでもありません。詳細は利用規約をご覧ください。
免責事項
この情報および投稿は、TradingViewが提供または推奨する金融、投資、トレード、その他のアドバイスや推奨を意図するものではなく、それらを構成するものでもありません。詳細は利用規約をご覧ください。