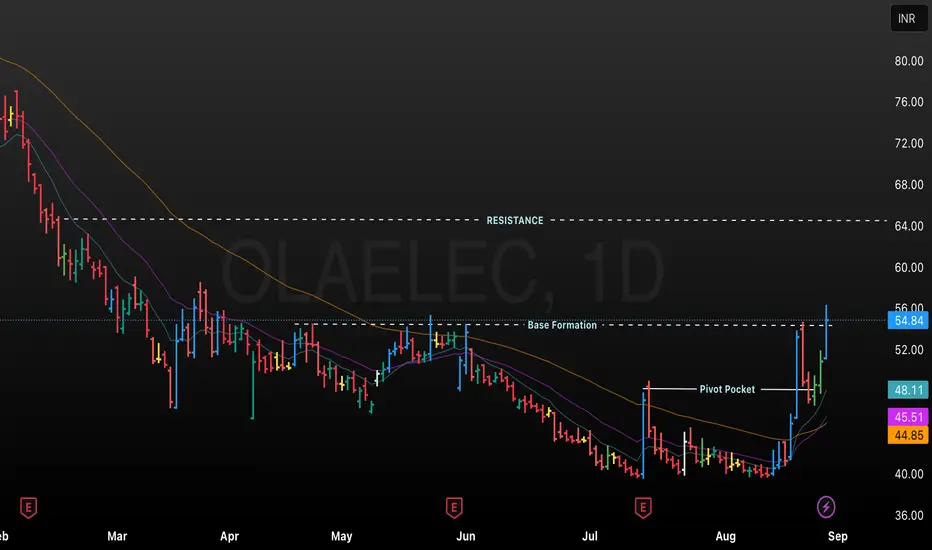
This chart displays the daily candlestick price action for OLA Electric, showing trends from February to August. Key technical levels are annotated, such as Resistance near 64, a Base Formation region, and a Pivot Pocket, indicating areas of price consolidation and breakout attempts. Moving averages (possibly 20-day, 50-day, and 200-day) are included, and the latest price is 54.84 INR, with a significant gain of +7.91% on the day. The chart is useful for analyzing support, resistance, and trend development in OLA Electric’s stock
免責事項
これらの情報および投稿は、TradingViewが提供または保証する金融、投資、取引、またはその他の種類のアドバイスや推奨を意図したものではなく、またそのようなものでもありません。詳しくは利用規約をご覧ください。
免責事項
これらの情報および投稿は、TradingViewが提供または保証する金融、投資、取引、またはその他の種類のアドバイスや推奨を意図したものではなく、またそのようなものでもありません。詳しくは利用規約をご覧ください。