After reviewing  OMC, inspired by an excellent idea posted by TopChartPatterns titled “A 10% rally is about to happen in OMC,” I decided to take a closer look at this potential investment.
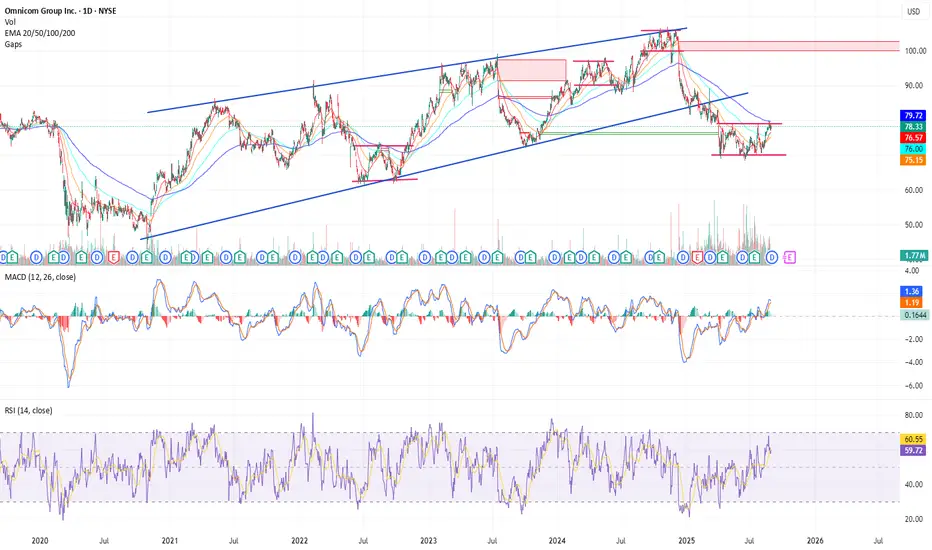
On the short-term chart,OMC is currently in a consolidation phase, forming a rectangle pattern with well-defined support and resistance levels. Key indicators, such as the MACD and a healthy RSI around 60, point toward bullish momentum. The price is trading above the 20, 50, and 100 EMAs and is now approaching the 200 EMA. In my view, a decisive breakout above the 200 EMA would serve as a strong bullish confirmation, potentially triggering a rally toward the blue resistance line and re-entering the long-standing rising wedge channel. That channel, which lasted for several years, demonstrated significant strength but was broken in February 2025 as bullish momentum across the waves visibly weakened.
In summary: with sufficient volume, a clean breakout above the $79 resistance could spark momentum buying, making the old wedge resistance line the next logical target for a retest.
On the short-term chart,
In summary: with sufficient volume, a clean breakout above the $79 resistance could spark momentum buying, making the old wedge resistance line the next logical target for a retest.
トレード稼働中
The stock has just completed a 5-wave Elliott count, and I expect it could pull back toward the $75 zone before starting a new impulse and breaking above resistance関連の投稿
免責事項
これらの情報および投稿は、TradingViewが提供または保証する金融、投資、取引、またはその他の種類のアドバイスや推奨を意図したものではなく、またそのようなものでもありません。詳しくは利用規約をご覧ください。
免責事項
これらの情報および投稿は、TradingViewが提供または保証する金融、投資、取引、またはその他の種類のアドバイスや推奨を意図したものではなく、またそのようなものでもありません。詳しくは利用規約をご覧ください。