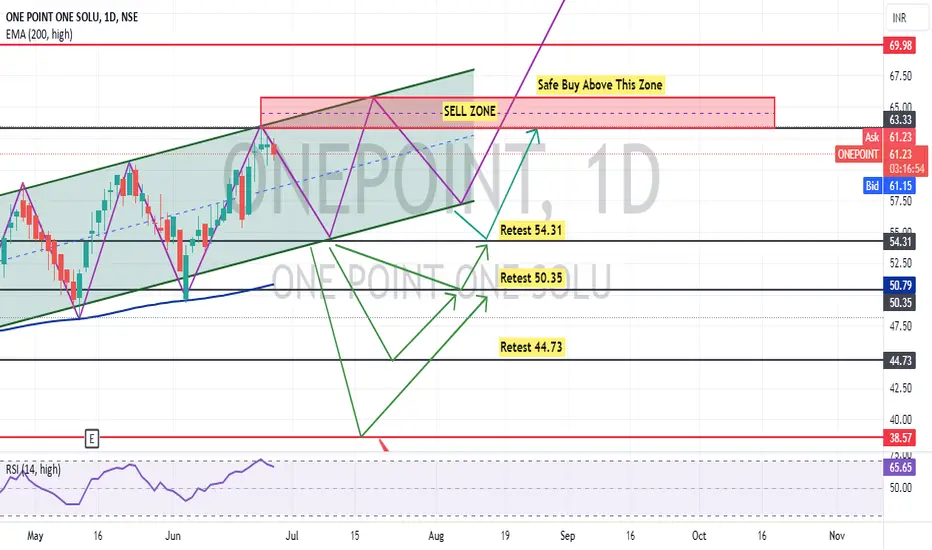
As per previous chart history and current chart pattern, ONEPOINT is making Higher Highs in one day time frame. Soon it will give a breakout either side
You can buy this stock at current market price @61.23 and make average on every dip as shown on the chart or you can wait for a dip to enter in the buy trade
This is my personal opinion and I am not suggesting anyone to buy this stock because I am NOT SEBI registered person
Thanks for your support as always
免責事項
この情報および投稿は、TradingViewが提供または推奨する金融、投資、トレード、その他のアドバイスや推奨を意図するものではなく、それらを構成するものでもありません。詳細は利用規約をご覧ください。
免責事項
この情報および投稿は、TradingViewが提供または推奨する金融、投資、トレード、その他のアドバイスや推奨を意図するものではなく、それらを構成するものでもありません。詳細は利用規約をご覧ください。