📊 Intraday Support & Resistance Levels
Support Levels:
₹201.10
₹199.70
₹198.60
Resistance Levels:
₹203.50
₹204.70
₹206.00
These levels are derived from recent price action and pivot point analysis.
🔍 Technical Indicators
Relative Strength Index (RSI): 62.39 — indicates a bullish momentum without being overbought.
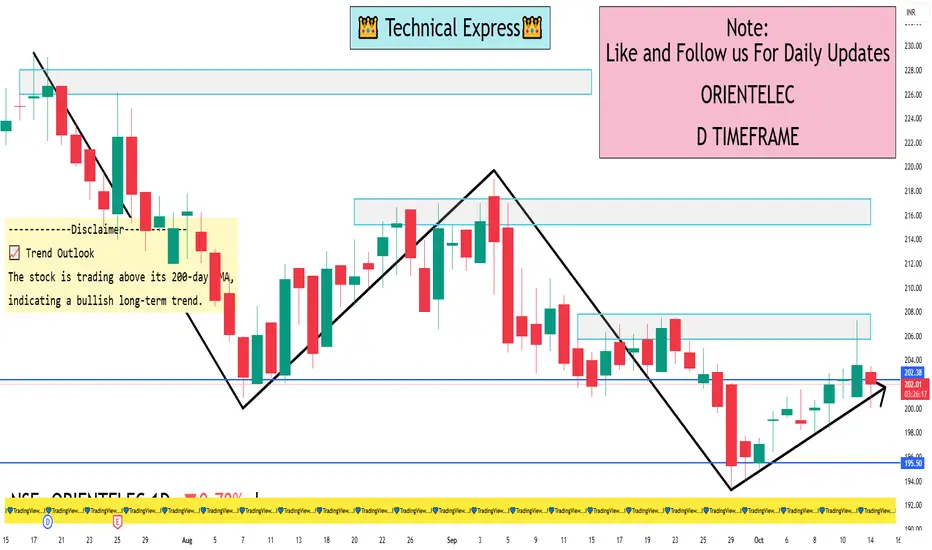
Moving Averages: The stock is above its 200-day exponential moving average (EMA), suggesting a positive long-term trend.
MACD: Neutral at 0.000, implying no strong directional momentum.
🔁 Pivot Points (Daily)
Central Pivot Point: ₹202.18
Resistance: ₹203.54 (R1), ₹204.65 (R2), ₹206.01 (R3)
Support: ₹201.07 (S1), ₹199.71 (S2), ₹198.60 (S3)
These levels are based on standard pivot point calculations and can help identify potential reversal zones.
Support Levels:
₹201.10
₹199.70
₹198.60
Resistance Levels:
₹203.50
₹204.70
₹206.00
These levels are derived from recent price action and pivot point analysis.
🔍 Technical Indicators
Relative Strength Index (RSI): 62.39 — indicates a bullish momentum without being overbought.
Moving Averages: The stock is above its 200-day exponential moving average (EMA), suggesting a positive long-term trend.
MACD: Neutral at 0.000, implying no strong directional momentum.
🔁 Pivot Points (Daily)
Central Pivot Point: ₹202.18
Resistance: ₹203.54 (R1), ₹204.65 (R2), ₹206.01 (R3)
Support: ₹201.07 (S1), ₹199.71 (S2), ₹198.60 (S3)
These levels are based on standard pivot point calculations and can help identify potential reversal zones.
I built a Buy & Sell Signal Indicator with 85% accuracy.
📈 Get access via DM or
WhatsApp: wa.link/d997q0
Contact - +91 76782 40962
| Email: techncialexpress@gmail.com
| Script Coder | Trader | Investor | From India
📈 Get access via DM or
WhatsApp: wa.link/d997q0
Contact - +91 76782 40962
| Email: techncialexpress@gmail.com
| Script Coder | Trader | Investor | From India
関連の投稿
免責事項
これらの情報および投稿は、TradingViewが提供または保証する金融、投資、取引、またはその他の種類のアドバイスや推奨を意図したものではなく、またそのようなものでもありません。詳しくは利用規約をご覧ください。