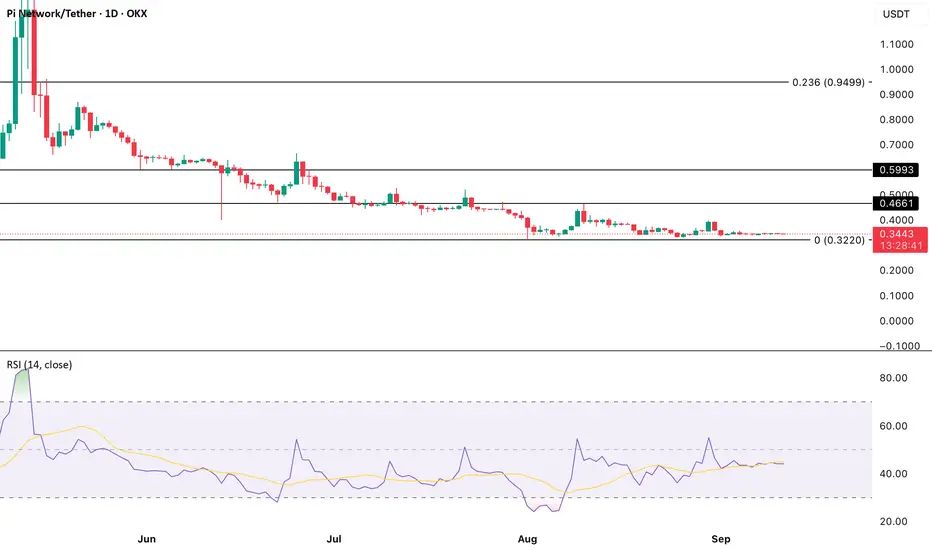
The PI spot market has struggled to show momentum since early September, a trend reflected in its Relative Strength Index (RSI). On the PI/USD daily chart, the RSI has remained flat.
The RSI measures overbought and oversold conditions on a scale of 0–100. Levels above 70 suggest overbought conditions and potential downside, while values below 30 point to oversold territory and possible recovery. With PI hovering near the midline, neither scenario is in play.
A flat RSI highlights a balance between buying and selling pressure, suggesting that neither bulls nor bears are in control. This equilibrium points to muted volatility. Unless momentum picks up, PI’s price is likely to stay constrained within its current narrow range.
Truly Unbiased Cryptocurrency News beincrypto.com
免責事項
これらの情報および投稿は、TradingViewが提供または保証する金融、投資、取引、またはその他の種類のアドバイスや推奨を意図したものではなく、またそのようなものでもありません。詳しくは利用規約をご覧ください。
Truly Unbiased Cryptocurrency News beincrypto.com
免責事項
これらの情報および投稿は、TradingViewが提供または保証する金融、投資、取引、またはその他の種類のアドバイスや推奨を意図したものではなく、またそのようなものでもありません。詳しくは利用規約をご覧ください。