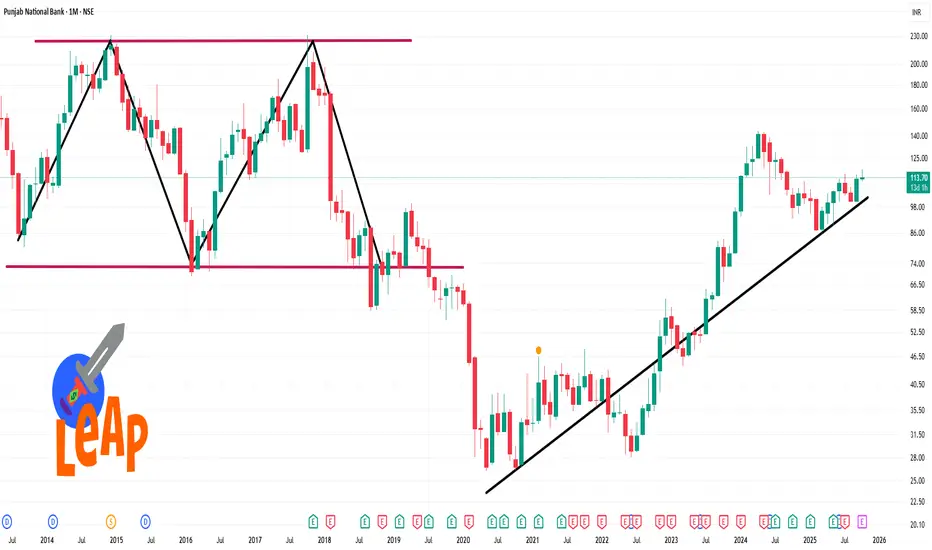
📊 Key Technical Indicators
Relative Strength Index (RSI): The 14-day RSI is approximately 59.6, suggesting the stock is neither overbought nor oversold, indicating a neutral stance.
Moving Averages:
20-day Simple Moving Average (SMA): 113.73 (bullish)
50-day SMA: 113.61 (bullish)
200-day SMA: 113.87 (bearish)
20-day Exponential Moving Average (EMA): 113.75 (bullish)
50-day EMA: 113.66 (bullish)
200-day EMA: 113.97 (bearish)
Moving Average Convergence Divergence (MACD): The MACD is positive, indicating bullish momentum.
Commodity Channel Index (CCI): The CCI is at 462.41, which is considered extremely overbought, suggesting potential for a pullback.
🔍 Support and Resistance Levels
Resistance: 117.24
Support: 111.4
関連の投稿
免責事項
この情報および投稿は、TradingViewが提供または推奨する金融、投資、トレード、その他のアドバイスや推奨を意図するものではなく、それらを構成するものでもありません。詳細は利用規約をご覧ください。
関連の投稿
免責事項
この情報および投稿は、TradingViewが提供または推奨する金融、投資、トレード、その他のアドバイスや推奨を意図するものではなく、それらを構成するものでもありません。詳細は利用規約をご覧ください。