🔎 Full Analysis
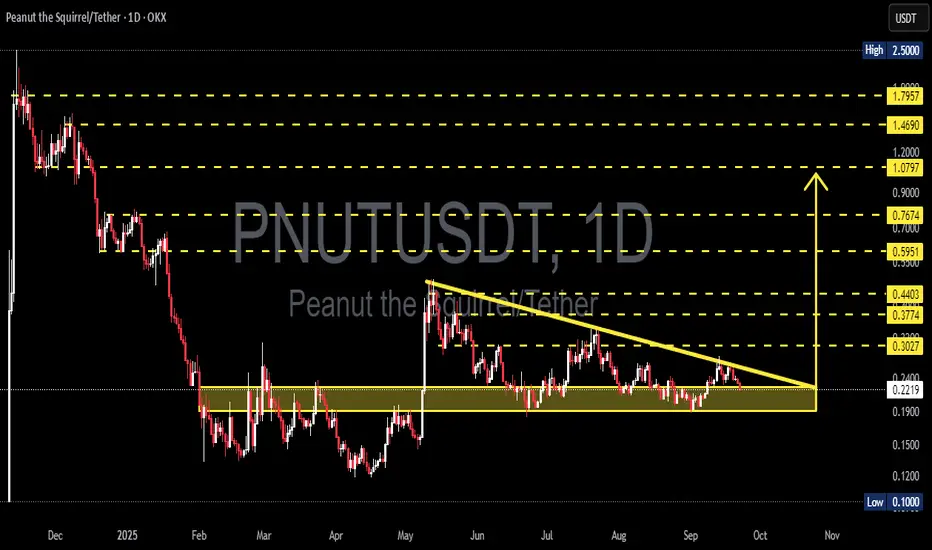
The PNU/USDT (1D) chart shows a clear Descending Triangle pattern that has been forming since May 2025. Price is currently trading around 0.2216 USDT, moving closer to the apex of the pattern — a sign that a big move is likely approaching.
⚙️ Pattern Details
Strong Support (Accumulation Zone): 0.19 – 0.24
This area has been tested multiple times and continues to attract buyers.
Descending Resistance: A downward sloping trendline from May’s high is pressing price lower, forming consecutive lower highs.
Characteristics: While this pattern is typically seen as a bearish continuation, it can also turn into an accumulation base if buyers step in with strong volume.
---
🚀 Bullish Scenario
Confirmation: Daily close above 0.3027 with strong volume.
Step-by-step targets:
First breakout level: 0.3027
Next targets: 0.3774 → 0.415 → 0.4403
Extended target if momentum accelerates: 0.5951
Measured Move Potential: A confirmed breakout projects a move toward 0.415 – 0.44 USDT.
Bullish Narrative: A breakout above the descending trendline could signal the start of a major reversal from long-term accumulation. Buyers regaining control may drive PNU/USDT back toward the 0.40 – 0.60 zone.
---
📉 Bearish Scenario
Confirmation: Daily close below 0.19 with high volume.
Step-by-step targets:
Conservative target: 0.10 USDT (chart low label)
Aggressive measured move target: 0.08 USDT
Bearish Narrative: If 0.19 fails as support, the descending triangle would act as a continuation pattern of the previous downtrend, potentially triggering a deeper breakdown toward 0.10 or even lower.
---
📌 Conclusion
PNU/USDT is at a critical decision point:
Bullish case: Breakout above the trendline could unlock a reversal and rally toward 0.40+.
Bearish case: Breakdown below 0.19 could extend the downtrend to 0.10 or lower.
With price approaching the apex, volatility is expected soon. Traders should wait for daily close + volume confirmation before committing to a position and apply strict risk management to avoid false breakouts.
---
⚡ Key Levels to Watch
Support zone: 0.19 – 0.24
Critical resistance: 0.3027
Breakout targets: 0.3774 → 0.415 → 0.4403 → 0.5951
Breakdown targets: 0.10 – 0.08
---
#PNUT #PNUTUSDT #PeanutTheSquirrel #TechnicalAnalysis #DescendingTriangle #CryptoAnalysis #Altcoin #Breakout #BearishOrBullish #CryptoTrading
✅ Get Free Signals! Join Our Telegram Channel Here: t.me/TheCryptoNuclear
✅ Twitter: twitter.com/crypto_nuclear
✅ Join Bybit : partner.bybit.com/b/nuclearvip
✅ Benefits : Lifetime Trading Fee Discount -50%
✅ Twitter: twitter.com/crypto_nuclear
✅ Join Bybit : partner.bybit.com/b/nuclearvip
✅ Benefits : Lifetime Trading Fee Discount -50%
免責事項
これらの情報および投稿は、TradingViewが提供または保証する金融、投資、取引、またはその他の種類のアドバイスや推奨を意図したものではなく、またそのようなものでもありません。詳しくは利用規約をご覧ください。