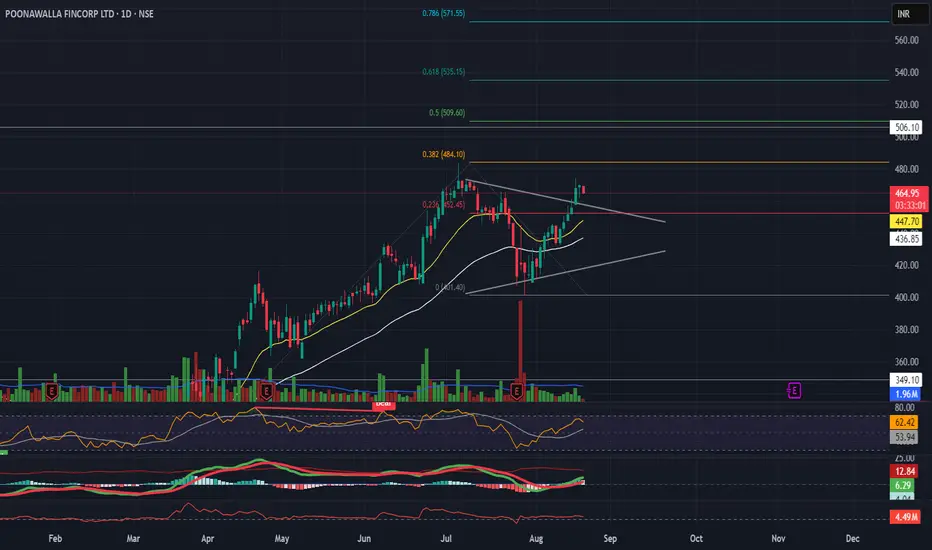
Setup: Clear breakout above trendline resistance on daily chart.
Indicators:
RSI at 62 → momentum strong, near overbought but not overheated.
MACD bullish crossover with positive histogram.
EMAs: 20 & 50 EMA slope positive; price sustaining above both.
Levels:
Stoploss: ₹445
Targets: ₹509 immediate, then ₹535
👉 Outlook: Strong bullish bias. Sustaining above ₹473 opens path towards ₹500–506 zone. Support at ₹445.
免責事項
この情報および投稿は、TradingViewが提供または推奨する金融、投資、トレード、その他のアドバイスや推奨を意図するものではなく、それらを構成するものでもありません。詳細は利用規約をご覧ください。
免責事項
この情報および投稿は、TradingViewが提供または推奨する金融、投資、トレード、その他のアドバイスや推奨を意図するものではなく、それらを構成するものでもありません。詳細は利用規約をご覧ください。