- The relative strength index (RSI) is a momentum indicator used in technical analysis. RSI measures the speed and magnitude of a security's recent price changes to detect overbought or oversold conditions in the price of that security. The RSI is displayed as an oscillator (a line graph) on a scale of 0 to 100
- Moving average convergence/divergence (MACD) is a technical indicator that helps investors identify price trends, measure trend momentum, and identify entry points for buying or selling a security. Gerald Appel developed the MACD indicator in the 1970s, and it is still one of the most popular technical tools today.
- Moving average convergence/divergence (MACD) is a technical indicator that helps investors identify price trends, measure trend momentum, and identify entry points for buying or selling a security. Gerald Appel developed the MACD indicator in the 1970s, and it is still one of the most popular technical tools today.
トレード稼働中
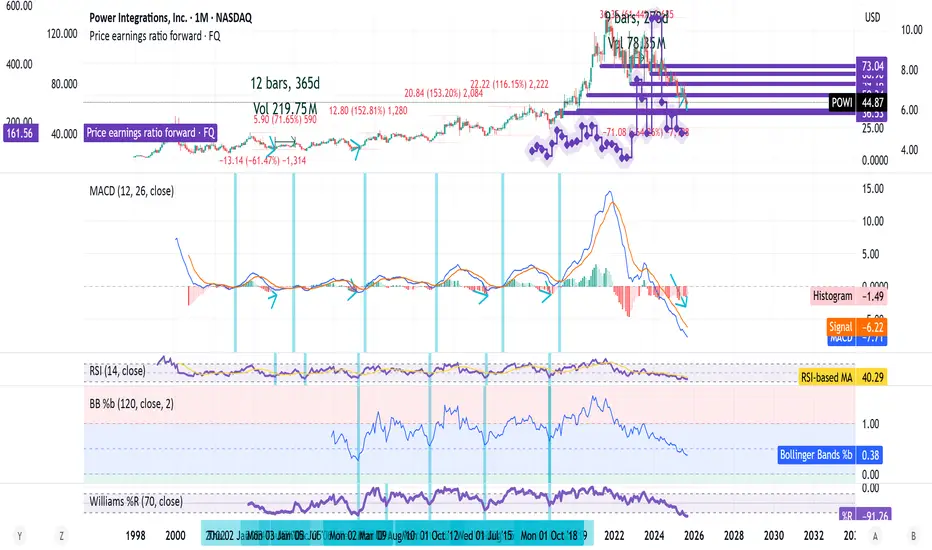
P/E Is really high comparing it with previous troughs !P/E Forward is in a very good place, probable trough in progress !
トレード終了: 利益確定目標に到達
Volume has no "Spike" in it to suggest a major trough has been struck, yet the averages is pretty high which may imply a trough is in already or about to be struck !
ノート
+60% in the next 10-12 Months if we rhythm with the past with everything in the universe absolute
ノート
Relative to SPX, we are pretty much like 2006's low, all else in the "Universe" absolute !I do more in depth studies of stocks on my twitter account. Hope you would enjoy it there as you are enjoying it here.
****** Past performance is no guarantee of future results***
twitter.com/samitrading1
****** Past performance is no guarantee of future results***
twitter.com/samitrading1
免責事項
これらの情報および投稿は、TradingViewが提供または保証する金融、投資、取引、またはその他の種類のアドバイスや推奨を意図したものではなく、またそのようなものでもありません。詳しくは利用規約をご覧ください。
I do more in depth studies of stocks on my twitter account. Hope you would enjoy it there as you are enjoying it here.
****** Past performance is no guarantee of future results***
twitter.com/samitrading1
****** Past performance is no guarantee of future results***
twitter.com/samitrading1
免責事項
これらの情報および投稿は、TradingViewが提供または保証する金融、投資、取引、またはその他の種類のアドバイスや推奨を意図したものではなく、またそのようなものでもありません。詳しくは利用規約をご覧ください。