Clear setup to share on PYPL
Main concepts of the chart:
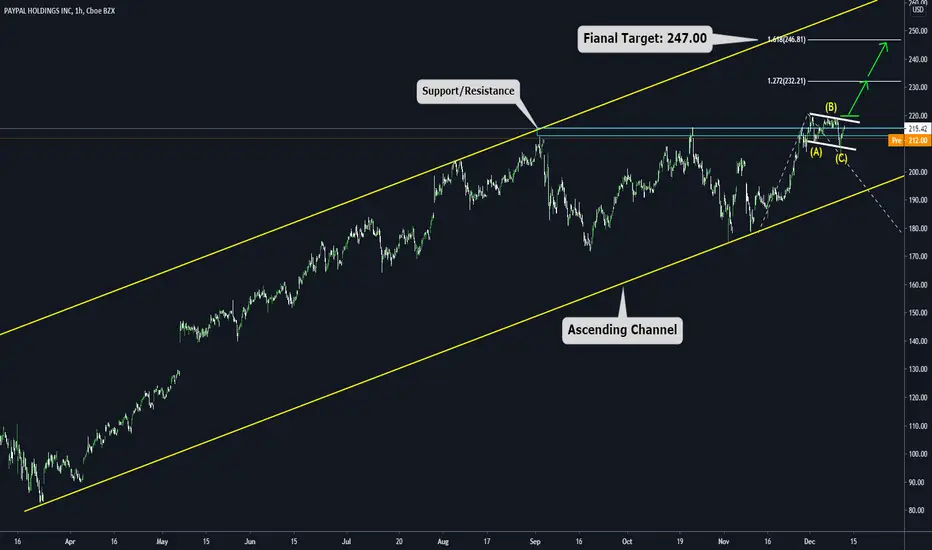
a) The price is inside a major ascending channel (Bullish Structure)
b) We saw a breakout of the last Resistance zone and the price moving on the edge of that level
c) On the edge of the Broken Resistance zone (now working as support), we can see a Flag Pattern (ABC Structure), which is considered a continuation structure (that means that we should expect a bullish movement after the breakout of it)
d) Now let's speak about targets: We have two levels, The first fibo extension (we will use it as a break-even level) and the second fibo extension as a final target
e) IF the trade goes in the expected direction, we think we can have a 15 - 20 days bullish impulse in terms of duration
f) IF the price does not go as expected, we will cancel our bullish view if we see a movement below "C."
Main concepts of the chart:
a) The price is inside a major ascending channel (Bullish Structure)
b) We saw a breakout of the last Resistance zone and the price moving on the edge of that level
c) On the edge of the Broken Resistance zone (now working as support), we can see a Flag Pattern (ABC Structure), which is considered a continuation structure (that means that we should expect a bullish movement after the breakout of it)
d) Now let's speak about targets: We have two levels, The first fibo extension (we will use it as a break-even level) and the second fibo extension as a final target
e) IF the trade goes in the expected direction, we think we can have a 15 - 20 days bullish impulse in terms of duration
f) IF the price does not go as expected, we will cancel our bullish view if we see a movement below "C."
免責事項
この情報および投稿は、TradingViewが提供または推奨する金融、投資、トレード、その他のアドバイスや推奨を意図するものではなく、それらを構成するものでもありません。詳細は利用規約をご覧ください。
免責事項
この情報および投稿は、TradingViewが提供または推奨する金融、投資、トレード、その他のアドバイスや推奨を意図するものではなく、それらを構成するものでもありません。詳細は利用規約をご覧ください。