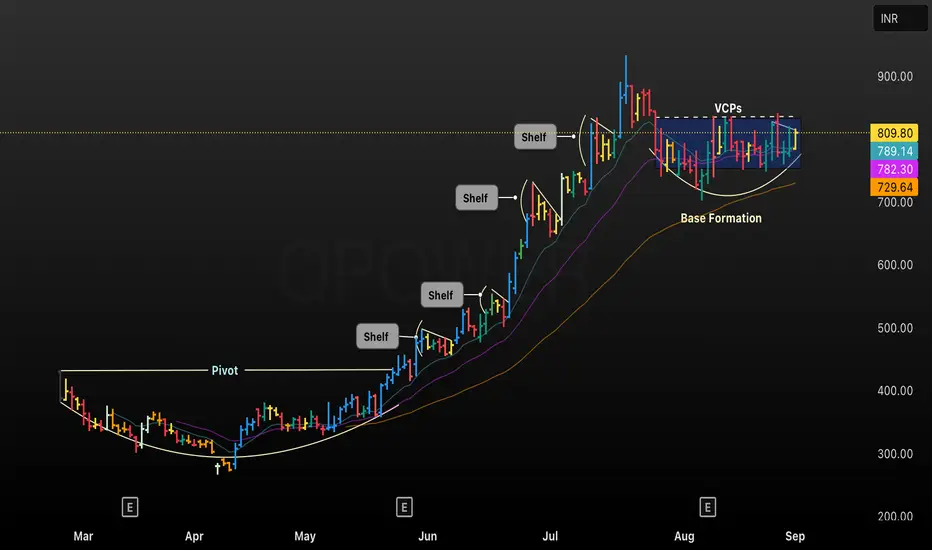
This TradingView chart of QPOWER showcases a classic growth stock progression from a Pivot breakout through multiple consolidation phases known as Shelves, indicated by horizontal pauses in price action above key moving averages. The recent price structure features a well-defined Base Formation followed by multiple VCPs (Volatility Contraction Patterns), signaling tightening price ranges and potential breakout readiness. Key moving averages are highlighted (789.14, 782.30, 729.64) to guide risk management for trend-following entries and exits.
• Technical patterns annotated: Pivot, Shelf, VCP, Base Formation
• Chart timeframe: Daily (D)
• Purpose: Used for trade decision-making and educational discussion on breakout setups and volatility contraction patterns
• Technical patterns annotated: Pivot, Shelf, VCP, Base Formation
• Chart timeframe: Daily (D)
• Purpose: Used for trade decision-making and educational discussion on breakout setups and volatility contraction patterns
免責事項
この情報および投稿は、TradingViewが提供または推奨する金融、投資、トレード、その他のアドバイスや推奨を意図するものではなく、それらを構成するものでもありません。詳細は利用規約をご覧ください。
免責事項
この情報および投稿は、TradingViewが提供または推奨する金融、投資、トレード、その他のアドバイスや推奨を意図するものではなく、それらを構成するものでもありません。詳細は利用規約をご覧ください。