Key Observations:
Uptrend Channel:
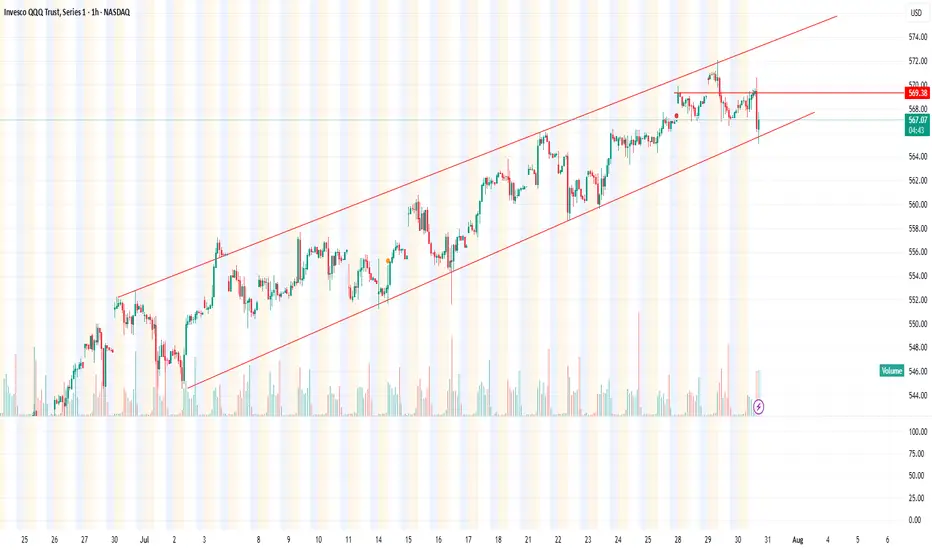
QQQ has been trading within a rising channel.
The price respects both the support (lower red trendline) and resistance (upper red trendline) consistently.
Recent Price Action:
There was a sharp drop that briefly broke below the lower trendline support but quickly rebounded back inside the channel, indicating a false breakdown or buying strength at support.
A horizontal red line marks a previous resistance level, now potentially acting as a support.
Current Price:
The price is around $567.22, near the middle of the channel, but just below the recent local high/resistance.
Implication:
As long as the price stays within the channel, the uptrend remains intact.
A confirmed breakdown below the channel support would be bearish, while a breakout above the channel resistance would be bullish.
Uptrend Channel:
QQQ has been trading within a rising channel.
The price respects both the support (lower red trendline) and resistance (upper red trendline) consistently.
Recent Price Action:
There was a sharp drop that briefly broke below the lower trendline support but quickly rebounded back inside the channel, indicating a false breakdown or buying strength at support.
A horizontal red line marks a previous resistance level, now potentially acting as a support.
Current Price:
The price is around $567.22, near the middle of the channel, but just below the recent local high/resistance.
Implication:
As long as the price stays within the channel, the uptrend remains intact.
A confirmed breakdown below the channel support would be bearish, while a breakout above the channel resistance would be bullish.
免責事項
これらの情報および投稿は、TradingViewが提供または保証する金融、投資、取引、またはその他の種類のアドバイスや推奨を意図したものではなく、またそのようなものでもありません。詳しくは利用規約をご覧ください。
免責事項
これらの情報および投稿は、TradingViewが提供または保証する金融、投資、取引、またはその他の種類のアドバイスや推奨を意図したものではなく、またそのようなものでもありません。詳しくは利用規約をご覧ください。