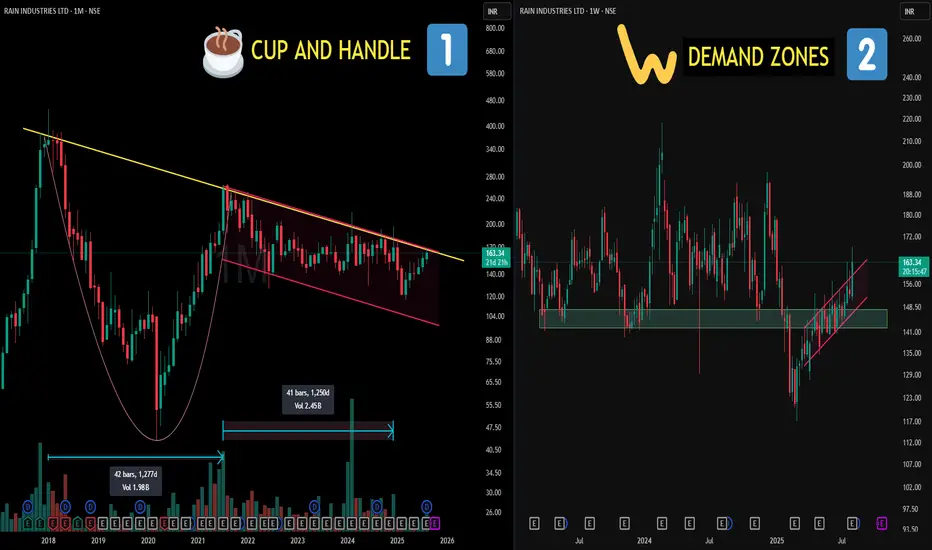
📌Left Side (Chart 1: Monthly TF)
🧠 Cup and Handle Pattern:
A bullish continuation pattern that resembles the shape of a tea cup on longer timeframes. The “cup” shows a gradual rounded bottom (accumulation phase), followed by a smaller downward or sideways "handle" (last shakeout), often before strength resumes. It reflects long-term accumulation and investor confidence.
📈 Cup Duration in this case : 1277 days (approx. 3.5 years)
🧠Parallel Channel (Handle):
A price structure where two trendlines contain price movement within a defined up or down slope. Often marks controlled consolidation or correction — neither side is dominating, until one breaks.
📈 Handle Formation in this case : 1250 days (approx. 3.4 years)
📌 Right Side (Chart 2: Weekly TF)
🧠 This is the zoom lens on the handle zone:
📍A key Demand Zone was breached temporarily… but reclaimed with conviction.
📍 Strong re-acceptance and consolidation followed, showing organized price behavior.
📍 The upper trendline of the parallel channel is where price recently pushed through — again, no forecasting — just a structural breakout from a well-defined zone.
🎯 Master My Self-Made Trading Strategy
📈 Telegram (Learn Today): t.me/hashtaghammer
✅ WhatsApp (Learn Today): wa.me/919455664601
📈 Telegram (Learn Today): t.me/hashtaghammer
✅ WhatsApp (Learn Today): wa.me/919455664601
関連の投稿
免責事項
これらの情報および投稿は、TradingViewが提供または保証する金融、投資、取引、またはその他の種類のアドバイスや推奨を意図したものではなく、またそのようなものでもありません。詳しくは利用規約をご覧ください。