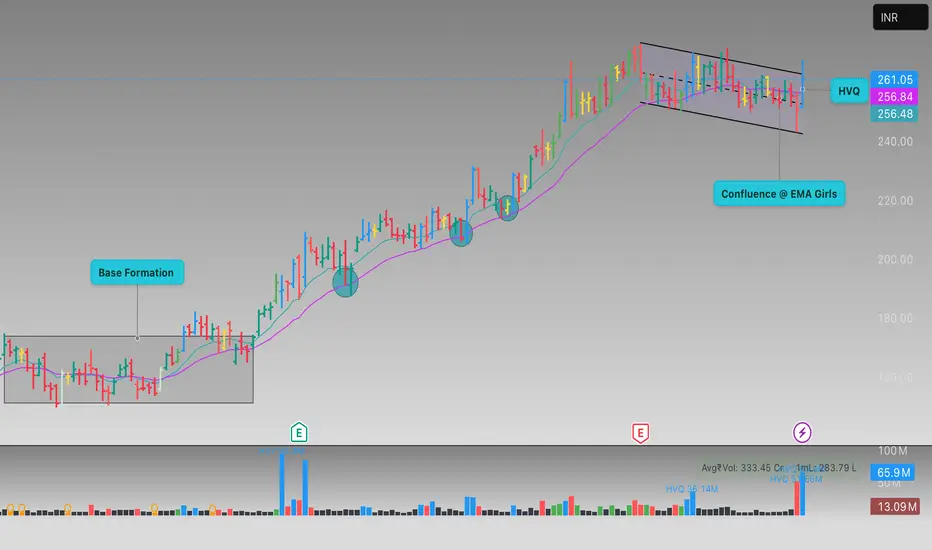
This TradingView chart displays the daily candlestick price movement of RBLBANK in INR, highlighting important technical patterns and zones. The chart features a “Base Formation” region, an upward breakout followed by steady bullish momentum, and a consolidation phase (flag channel) at higher levels. Key technical elements include two Exponential Moving Averages (EMAs), support and resistance zones, and high volume clusters (HVQ) indicating significant trading activity. Annotations such as “Confluence @ EMA” and volume bars further assist in identifying potential entry and exit points for traders.
免責事項
これらの情報および投稿は、TradingViewが提供または保証する金融、投資、取引、またはその他の種類のアドバイスや推奨を意図したものではなく、またそのようなものでもありません。詳しくは利用規約をご覧ください。
免責事項
これらの情報および投稿は、TradingViewが提供または保証する金融、投資、取引、またはその他の種類のアドバイスや推奨を意図したものではなく、またそのようなものでもありません。詳しくは利用規約をご覧ください。