https://www.tradingview.com/x/mFwswPSt
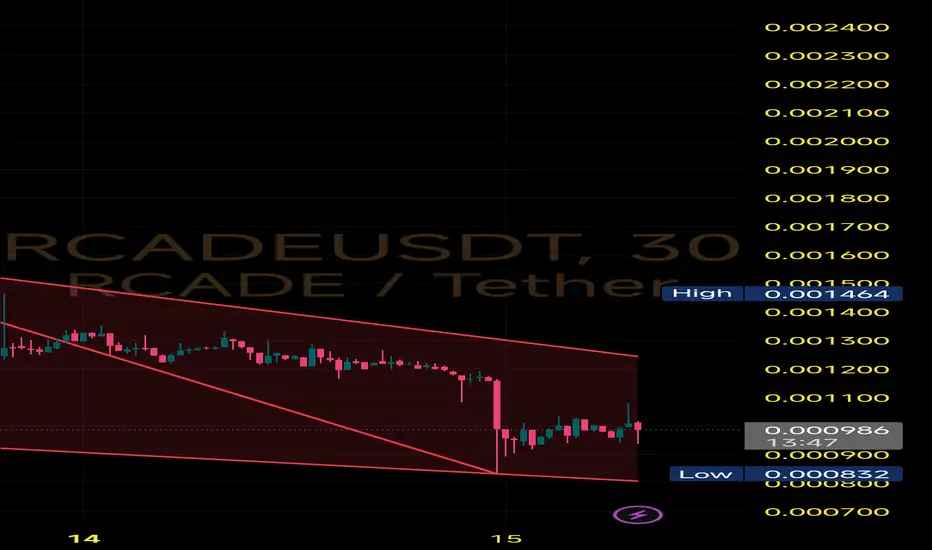
A falling wedge is formed when price makes lower highs and lower lows within converging trendlines. It’s typically a bullish pattern, especially after an extended downtrend like this one.
Current Situation - Price touched the lower wedge boundary at $0.000832 (latest local low)
Multiple taps on both support and resistance trendlines confirm wedge validity
Quick rebound from the wedge bottom hints that buyers are stepping in
🔹Breakout zone above $0.00110–$0.00115 could trigger rapid move
🔸Immediate resistance levels: $0.00130 → $0.00150 → $0.00180
⚠️ Invalidation:
A breakdown below $0.00083 with high volume would invalidate the wedge and resume the downtrend.
免責事項
これらの情報および投稿は、TradingViewが提供または保証する金融、投資、取引、またはその他の種類のアドバイスや推奨を意図したものではなく、またそのようなものでもありません。詳しくは利用規約をご覧ください。
免責事項
これらの情報および投稿は、TradingViewが提供または保証する金融、投資、取引、またはその他の種類のアドバイスや推奨を意図したものではなく、またそのようなものでもありません。詳しくは利用規約をご覧ください。