Price Movement (1H Candles)
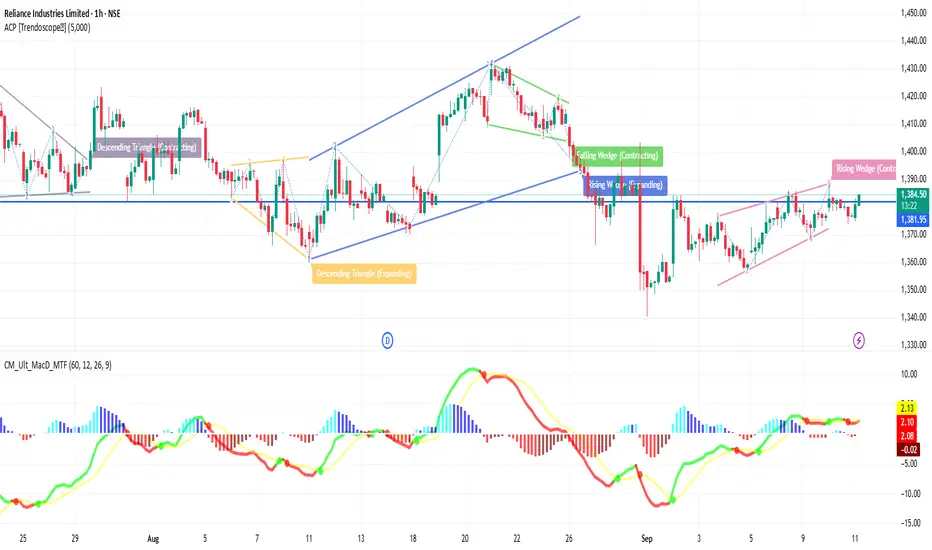
Reliance is trading around ₹1,381 – ₹1,383.
On the 1-hour chart, candles are showing sideways consolidation between ₹1,375 (support) and ₹1,385 (resistance).
This tells us that buyers and sellers are in balance, waiting for a breakout.
2️⃣ Support & Resistance Zones
Immediate Support: ~₹1,375 → If this breaks, price may slip toward ₹1,360.
Stronger Support: ~₹1,345 – ₹1,340 → A key zone where buyers may return strongly.
Immediate Resistance: ~₹1,385 → A breakout above can open the way to ₹1,395 – ₹1,400.
Major Resistance: ~₹1,415 – ₹1,420 → If crossed, trend becomes strongly bullish.
3️⃣ Indicators (1H View)
20 EMA: Very close to current price, showing consolidation.
50 EMA: Just below current levels, acting as dynamic support.
200 EMA: Much lower, confirming long-term uptrend is intact.
RSI: Neutral (around 50) → market is not overbought, not oversold.
MACD: Flat → no clear momentum yet, waiting for direction.
4️⃣ Trend Explanation
Right now, the 1-hour trend is neutral to mildly bullish.
If Reliance holds above ₹1,375 – ₹1,360, bulls remain in control.
A move above ₹1,385 with volume can trigger a rally toward ₹1,400+.
But if Reliance breaks below ₹1,360, weakness may appear, and the next fall could be toward ₹1,340.
5️⃣ Conclusion (1H Time Frame)
Sideways Phase: Reliance is consolidating in a narrow band.
Bullish Signal: Above ₹1,385 with good buying volume.
Bearish Signal: Below ₹1,375, deeper support around ₹1,360.
Traders should wait for a breakout or breakdown before taking big positions.
関連の投稿
免責事項
これらの情報および投稿は、TradingViewが提供または保証する金融、投資、取引、またはその他の種類のアドバイスや推奨を意図したものではなく、またそのようなものでもありません。詳しくは利用規約をご覧ください。
関連の投稿
免責事項
これらの情報および投稿は、TradingViewが提供または保証する金融、投資、取引、またはその他の種類のアドバイスや推奨を意図したものではなく、またそのようなものでもありません。詳しくは利用規約をご覧ください。