The Russell 2000 index is recovering this week's losses
This week, the markets suffered a major crash, with many overextended waves.
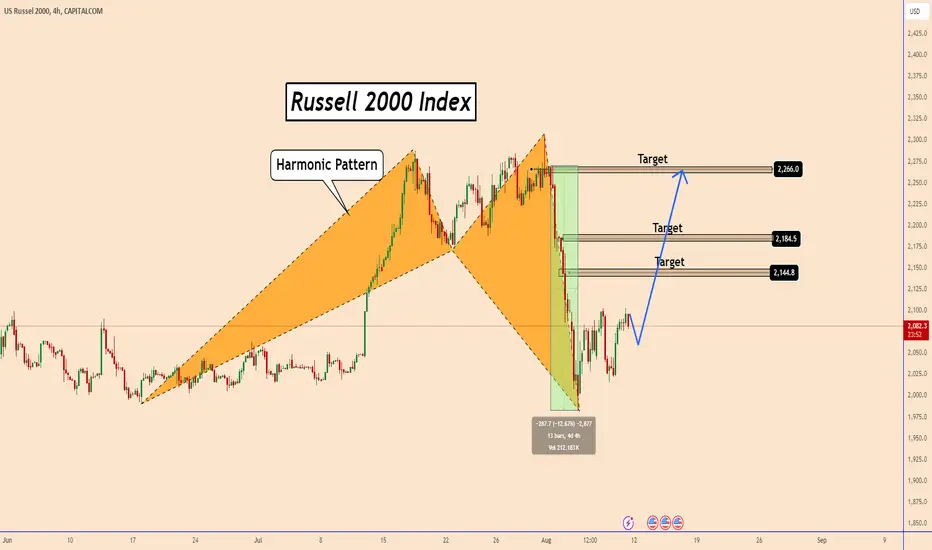
This is clearly shown in the RTY chart where the price dropped by nearly 12.50% in just 3 days.
It wasn't clear why it happened, but as we can see RTY completed a large and bullish harmonic pattern with overextended legs.
As long as the market calmed down, it seems like the perfect time for a correction.
The Russell 2000 is expected to test 2145, and 2185 during the coming week.
The last target near 2265 will take time.
You may find more details in the chart!
Thank you and Good Luck!
❤️PS: Please support with a like or comment if you find this analysis useful for your trading day❤️
This week, the markets suffered a major crash, with many overextended waves.
This is clearly shown in the RTY chart where the price dropped by nearly 12.50% in just 3 days.
It wasn't clear why it happened, but as we can see RTY completed a large and bullish harmonic pattern with overextended legs.
As long as the market calmed down, it seems like the perfect time for a correction.
The Russell 2000 is expected to test 2145, and 2185 during the coming week.
The last target near 2265 will take time.
You may find more details in the chart!
Thank you and Good Luck!
❤️PS: Please support with a like or comment if you find this analysis useful for your trading day❤️
トレード終了: 利益確定目標に到達
✅MY FREE Signals Channel
t.me/TradingPuzzles
✅Personal Telegram
t.me/KlejdiCuni
✅Suggested News Channel
t.me/ForexNewsNavigator_Official
t.me/TradingPuzzles
✅Personal Telegram
t.me/KlejdiCuni
✅Suggested News Channel
t.me/ForexNewsNavigator_Official
免責事項
これらの情報および投稿は、TradingViewが提供または保証する金融、投資、取引、またはその他の種類のアドバイスや推奨を意図したものではなく、またそのようなものでもありません。詳しくは利用規約をご覧ください。