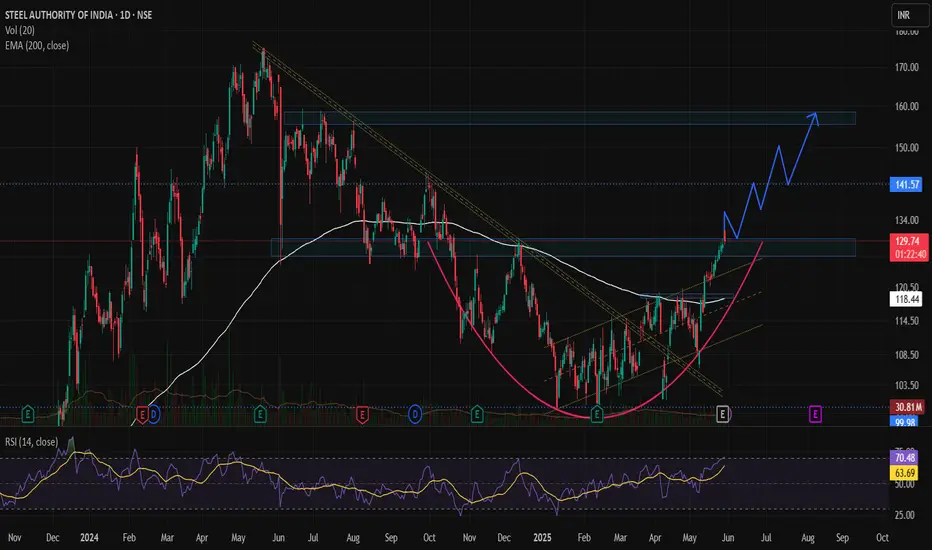
A trend reversal appears to be taking shape in SAIL, indicating a potential shift from a downtrend to an uptrend. The stock has recently came out of a falling trendline and has closed above its 200-day EMA, placed at ₹117, signaling renewed strength and buyer interest.
🔄 Technical Outlook
- Breakout Zone: SAIL gave a technical breakout at ₹117, which aligns with its 200 EMA (Day), a widely tracked long-term moving average.
- Current Price Action: The stock is now trading at around ₹130, emerging from a rounding bottom pattern, which is a bullish continuation pattern indicating accumulation and base formation.
- Volume Analysis: Recent trading sessions have shown notable volume spikes, supporting the bullish breakout and trend reversal narrative.
- Fundamental Trigger: Q4 Results have been decent, providing a fundamental cushion to the technical setup. While not overly bullish, the results are good enough to support the ongoing trend reversal, especially if broader market sentiment remains stable.
📊 Support & Resistance Levels
- Crucial Support Zone: ₹127–₹130 — holding this zone is key for sustaining the bullish move.
- Key Breakout Zone: ₹127–₹130 — staying above this range will confirm the breakout and strengthen the upward move.
- Stop Loss: A protective stop-loss at ₹115, which lies just below the 200-day EMA, is advisable to manage downside risk.
🎯 Target Levels
First Target: ₹140
Second Target: ₹150
Final Target: ₹158
Time Frame: Expected to take 2–2.5 months to achieve the projected targets if momentum continues.
免責事項
この情報および投稿は、TradingViewが提供または推奨する金融、投資、トレード、その他のアドバイスや推奨を意図するものではなく、それらを構成するものでもありません。詳細は利用規約をご覧ください。
免責事項
この情報および投稿は、TradingViewが提供または推奨する金融、投資、トレード、その他のアドバイスや推奨を意図するものではなく、それらを構成するものでもありません。詳細は利用規約をご覧ください。