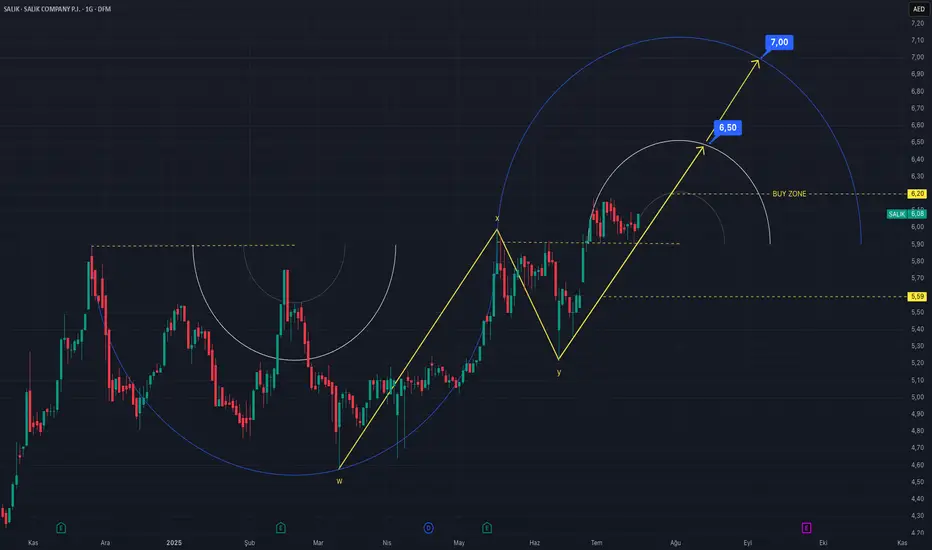
This is a daily chart for Salik Company (SALIK) - UAE showing a bullish technical analysis setup.
Analysis Breakdown:
Pattern Identification: The analyst has identified a complex corrective pattern labeled as "W-X-Y." This is a type of Elliott Wave correction, suggesting that a longer-term downtrend or consolidation phase has completed at the point marked "Y".
New Uptrend: Following the completion of the "Y" wave at a low point, the stock has started a new upward trend, indicated by the rising yellow trendline.
Support and Entry:
The yellow trendline starting from the "Y" low is acting as the primary dynamic support for the current rally.
A "BUY ZONE" is marked around the 5.20 price level. The analyst suggests this area as a potential entry point for a long (buy) position, likely anticipating a minor pullback to this zone before the next leg up.
Price Targets: The analysis projects two potential upward targets, seemingly derived from the intersection of the rising trendline and the large blue arcs (which could be Fibonacci or Gann arcs):
First Target (PT1): 6.50
Second Target (PT2): 7.00
Tools Used: The chart uses trendlines, Elliott Wave patterns (W-X-Y), and circular arcs to identify the trend, support/resistance levels, and future price objectives.
Summary:
The overall sentiment of this chart is bullish. The analysis suggests that Salik's stock has finished its correction and has now entered a new upward phase. The key strategy presented is to enter a buy position around the 5.20 "BUY ZONE," with expectations for the price to rise towards the 6.50 and subsequently the 7.00 targets in the medium term.
Disclaimer: This is an interpretation of the technical analysis presented in the image. It is not financial advice.
免責事項
この情報および投稿は、TradingViewが提供または推奨する金融、投資、トレード、その他のアドバイスや推奨を意図するものではなく、それらを構成するものでもありません。詳細は利用規約をご覧ください。
免責事項
この情報および投稿は、TradingViewが提供または推奨する金融、投資、トレード、その他のアドバイスや推奨を意図するものではなく、それらを構成するものでもありません。詳細は利用規約をご覧ください。