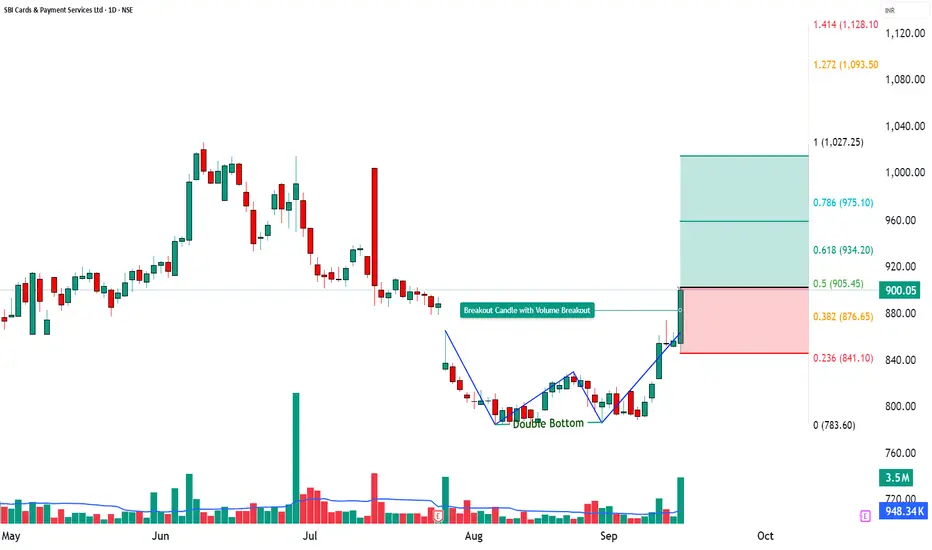
📊 SBICARD Trade Analysis
🔎 Price Action
SBICARD closed at ₹900.05 with a sharp +5.13% gain, backed by a volume of 35.03 lakh, far higher than its 20-day average of 9.48 lakh (VolX = 3.67x).
This massive surge in activity highlights aggressive buying and momentum revival after a consolidation phase.
________________________________________
📉 Chart Signals – Double Bottom Pattern Breakout
Strong bullish candle with heavy volumes.
RSI breakout + CCI strength confirming trend.
Bollinger Band breakout → signals upside continuation.
________________________________________
📍 Key Levels
Resistance: 919 – 938 – 974
Support: 863 – 827 – 808
________________________________________
📈 Investment Outlook
📈 Bullish Case – Why the stock could go up
High-volume breakout (VolX = 3.67x) signals strong participation.
Momentum indicators (RSI 74, CCI 238, Stochastic 98) confirm overbought strength.
Upside potential toward ₹959 – ₹1015 if buying sustains.
📉 Bearish Case – Potential downside risks
Failure to hold above ₹902 could lead to profit booking.
High RSI suggests short-term overbought → risk of pullback.
A break below ₹863 may drag toward ₹827 – ₹808.
⚡ Momentum Case – Short-term Trading Edge
Volume breakout + RSI strength highlight bullish edge.
Bollinger Band breakout points to strong near-term volatility.
Holding above ₹902–919 may fuel rally toward ₹958–₹1015.
📅 Short-term vs Long-term Perspective
Short-term (1–2 weeks): Likely to test resistances 919–974; supports 863–827 remain key.
Long-term (1–3 months): Stock in recovery phase; sustained volumes and trend strength could establish higher base above ₹900.
________________________________________
📝 STWP Trade Analysis
Outlook: Momentum: Moderate, Trend: Neutral
Entry: 902 | Stop-loss: 845.32
Target-1: 958.68 | Target-2: 1015.36
Risk/Reward: 1:6.08 | Risk: High | Volume: High
Demand Zone: 874 – 850.05 | SL: 848.95(Pullback Zone)
Learning Note: SBICARD is showing momentum revival with strong volumes; watch for sustainability above ₹900 to confirm trend continuation.
________________________________________
⚠️ Disclaimer – Please Read Carefully
The information shared here is meant purely for learning and awareness. It is not a buy or sell recommendation and should not be taken as investment advice. I am not a SEBI-registered investment advisor, and all views expressed are based on personal study, chart patterns, and publicly available market data.
Trading — whether in stocks or options — carries risk. Markets can move unexpectedly, and losses can sometimes exceed the money you have invested. Past performance or past setups do not guarantee future results.
If you are a beginner, treat this as a guide to understand how the market works — practice on paper trades before risking real money. If you are experienced, always assess your own risk, position sizing, and strategy suitability before entering trades.
Consult a SEBI-registered financial advisor before making any real trading decision. By engaging with this content, you acknowledge full responsibility for your trades and investments.
💬 Found this useful?
🔼 Give this post a Boost to help more traders discover clean, structured learning.
✍️ Drop your thoughts, questions, or setups in the comments — let’s grow together!
🔁 Share with fellow traders and beginners to spread awareness.
👉 “If you liked this breakdown, follow for more clean, structured setups with discipline at the core.”
🚀 Stay Calm. Stay Clean. Trade With Patience.
Trade Smart | Learn Zones | Be Self-Reliant 📊
📊 STWP | Mentor | Demand & Supply Specialist
🎯 Helping you become a self-reliant & independent trader
🎓 Learn more: simpletradewithpatience.com
📲 WhatsApp: wa.me/919987567889
🔍 Trade with Clarity. Learn with Patience.
🎯 Helping you become a self-reliant & independent trader
🎓 Learn more: simpletradewithpatience.com
📲 WhatsApp: wa.me/919987567889
🔍 Trade with Clarity. Learn with Patience.
免責事項
これらの情報および投稿は、TradingViewが提供または保証する金融、投資、取引、またはその他の種類のアドバイスや推奨を意図したものではなく、またそのようなものでもありません。詳しくは利用規約をご覧ください。