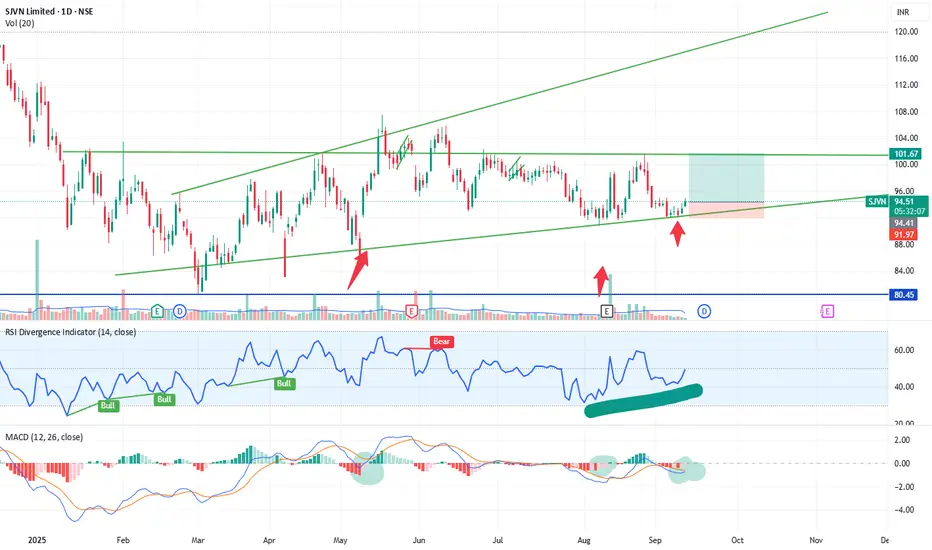
SJVN Ltd. is showing signs of a potential bullish reversal after taking support at the lower boundary of an ascending channel. The stock has formed a consistent pattern of higher lows and is currently trading at ₹94.55 with increasing volume and positive momentum on key indicators.
✅ Key Technical Highlights:
📈 Chart Pattern:
Trading within a well-defined ascending channel.
Recently bounced off the channel support line (third touch confirmation).
Next resistance zone lies near ₹101.67, which aligns with the upper trendline and horizontal supply zone.
📊 Indicators:
RSI Divergence: Bullish divergence seen — RSI made a higher low while price made a lower low, signaling potential reversal.
MACD Bullish Crossover: MACD line has crossed above the signal line near oversold levels — historically a strong bullish sign.
Volume: Notable volume spike observed at support — indicating accumulation.
📏 Risk-Reward Zone (For Study Purposes Only):
Entry Zone: ₹93–₹95
Target: ₹101–₹102
Stop Loss: Below ₹91.97
⚠️ Note:
This post is purely for educational and analysis purposes only. It is not a recommendation to buy or sell any security. Always do your own research or consult a qualified advisor before making investment decisions.
免責事項
これらの情報および投稿は、TradingViewが提供または保証する金融、投資、取引、またはその他の種類のアドバイスや推奨を意図したものではなく、またそのようなものでもありません。詳しくは利用規約をご覧ください。
免責事項
これらの情報および投稿は、TradingViewが提供または保証する金融、投資、取引、またはその他の種類のアドバイスや推奨を意図したものではなく、またそのようなものでもありません。詳しくは利用規約をご覧ください。