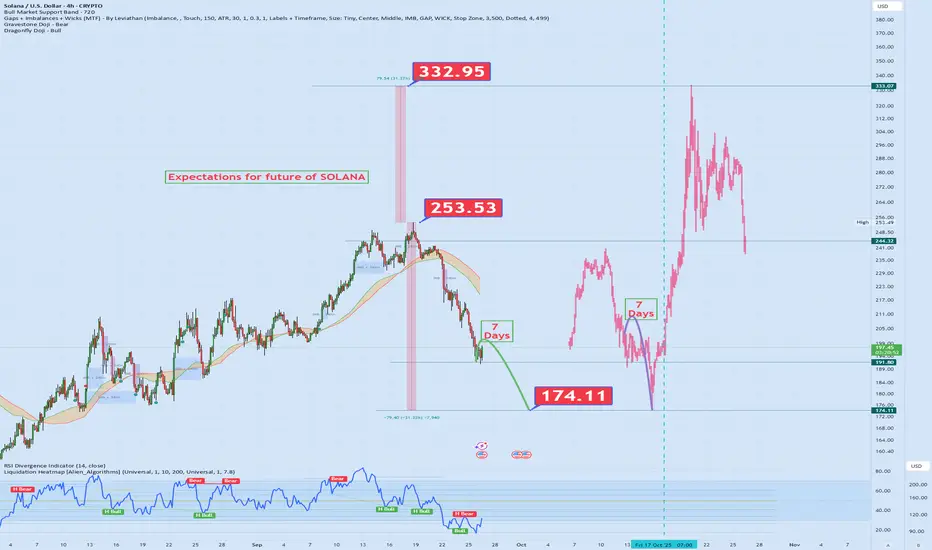
I've combined past price action with future possibilities on the SOL chart. Here are the key highlights:
🚀 Peak Level: 332.95 📉 Correction Zone: 253.53 🛑 Support Area: 174.11
📍 Supported by RSI and moving averages, the red line represents my personal expectation. It points to a potential recovery and a new bullish trend. 💥
🔁 I’ve mapped out scenario-based planning using historical price behavior—now my eyes are on that red trajectory! 💡 Technical analysis + intuition = strategic positioning!
📌 What do you think? Will this scenario play out? Drop your thoughts below! 👇
免責事項
これらの情報および投稿は、TradingViewが提供または保証する金融、投資、取引、またはその他の種類のアドバイスや推奨を意図したものではなく、またそのようなものでもありません。詳しくは利用規約をご覧ください。
免責事項
これらの情報および投稿は、TradingViewが提供または保証する金融、投資、取引、またはその他の種類のアドバイスや推奨を意図したものではなく、またそのようなものでもありません。詳しくは利用規約をご覧ください。