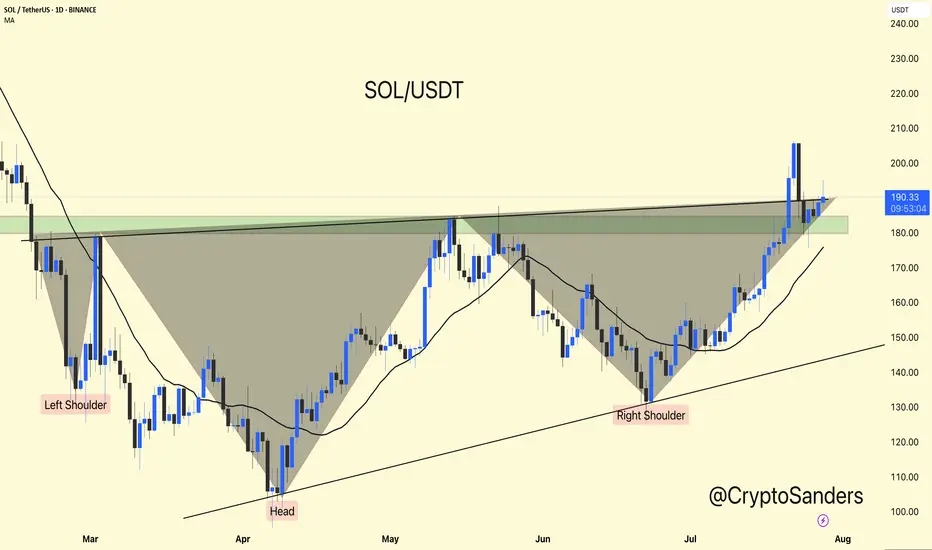
Solana has completed a classic Inverse Head and Shoulders pattern, breaking out above the neckline near the $185–$190 zone.
Currently holding above the breakout zone, showing bullish strength.
As long as SOL stays above the neckline support, continuation toward $210–$230 remains likely.
Trend remains strong above the moving average.
Stay updated and manage your risk accordingly.
DYOR | NFA
Currently holding above the breakout zone, showing bullish strength.
As long as SOL stays above the neckline support, continuation toward $210–$230 remains likely.
Trend remains strong above the moving average.
Stay updated and manage your risk accordingly.
DYOR | NFA
関連の投稿
免責事項
これらの情報および投稿は、TradingViewが提供または保証する金融、投資、取引、またはその他の種類のアドバイスや推奨を意図したものではなく、またそのようなものでもありません。詳しくは利用規約をご覧ください。
関連の投稿
免責事項
これらの情報および投稿は、TradingViewが提供または保証する金融、投資、取引、またはその他の種類のアドバイスや推奨を意図したものではなく、またそのようなものでもありません。詳しくは利用規約をご覧ください。