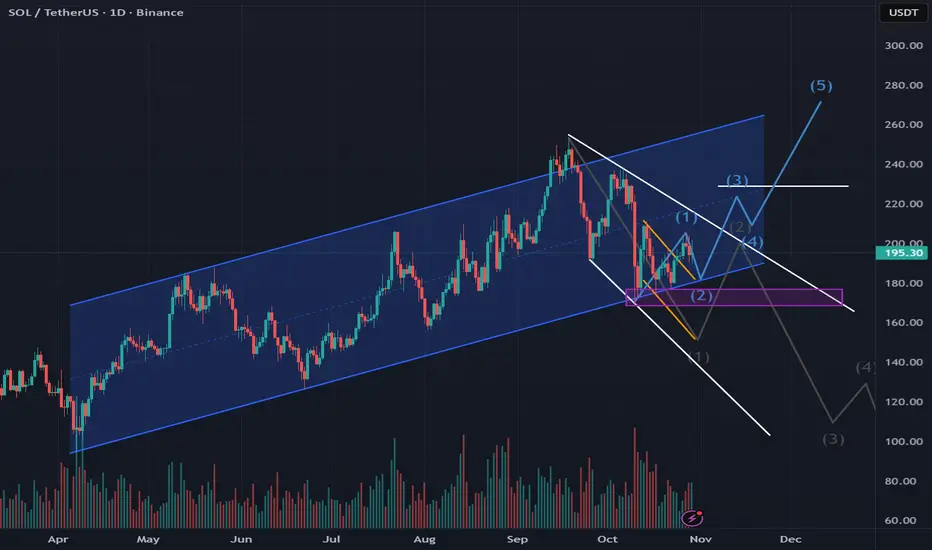
SOL has formed a very interesting pattern and situation...
On the one hand, we see:
- confident movement within an ascending channel (marked in blue)
- positive news regarding SOL and the ETF
- a locally formed bullish flag, which fulfilled the expected movement (marked in yellow)
On the other hand, we see:
- a formed descending expanding wedge (marked in white), within which the global trend should have developed and become downward
- theoretically, the movement and formation of the first corrective Elliott wave (marked in dark gray) was determined within it
- buyers are preventing either the pattern or the wave from forming
The situation is interesting because we clearly see how the price is rebounding strictly along the lower boundary of the ascending channel, preventing a downward movement according to the pattern (marked in white) from forming, indicating the strength of the buyers. At this time, we also see the possible formation of a second corrective wave within the upward movement.
Current price: $193.40
An upward movement is most likely expected, with a breakout from the descending expanding wedge, within the ascending channel, to levels of $206, $220, and above...
A breakout into the $176 and $166 zone is also possible, and if the price goes lower, the current pattern will be broken.
More detailed analysis, additional charts, and key levels to watch are available on our site
免責事項
これらの情報および投稿は、TradingViewが提供または保証する金融、投資、取引、またはその他の種類のアドバイスや推奨を意図したものではなく、またそのようなものでもありません。詳しくは利用規約をご覧ください。
免責事項
これらの情報および投稿は、TradingViewが提供または保証する金融、投資、取引、またはその他の種類のアドバイスや推奨を意図したものではなく、またそのようなものでもありません。詳しくは利用規約をご覧ください。