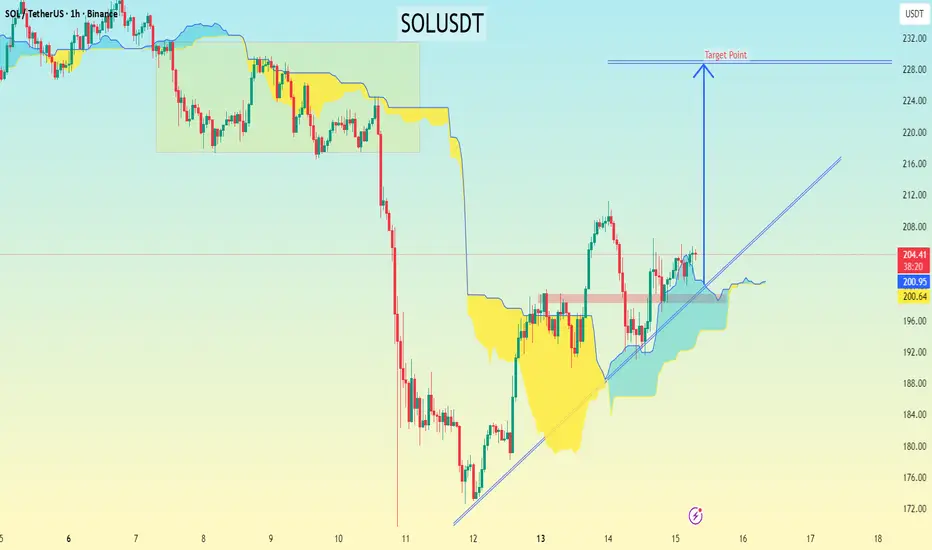
SOLUSDT chart (1-hour timeframe), here’s a detailed breakdown of the setup and the potential target based on the price structure and Ichimoku setup:
---
🔍 Chart Observations
Current price: around $205
The price has broken above the Ichimoku Cloud, confirming a short-term bullish bias.
A rising trendline from the $180 area is providing strong support.
The “Target Point” label I have drawn sits roughly around $230–232.
The cloud (Kumo) is bullish and widening, suggesting potential continuation upward.
---
🎯 Target Levels
Based on structure and Ichimoku confirmation:
1. First target (short-term): $212 — local resistance area / psychological level
2. Main target: $228–232 — aligns perfectly with my chart’s “Target Point” label and previous swing-high zone
3. Extended target (if momentum continues): $240 — strong resistance from the last consolidation before the drop
---
🛑 Stop-Loss Suggestion
Below the trendline or the Kumo support: around $198–200
(A clean break below this would invalidate the bullish setup.)
---
⚖ Trade Plan Summary
Type Entry Stop Target 1 Target 2 Risk:Reward
Long $204–206 $198 $212 $228–232 ~1:2.5–1:3
---
📈 Summary:
Trend = Bullish
Entry = On retest of $202–205 area
Target = $228–232
Stop = Below $198
---
🔍 Chart Observations
Current price: around $205
The price has broken above the Ichimoku Cloud, confirming a short-term bullish bias.
A rising trendline from the $180 area is providing strong support.
The “Target Point” label I have drawn sits roughly around $230–232.
The cloud (Kumo) is bullish and widening, suggesting potential continuation upward.
---
🎯 Target Levels
Based on structure and Ichimoku confirmation:
1. First target (short-term): $212 — local resistance area / psychological level
2. Main target: $228–232 — aligns perfectly with my chart’s “Target Point” label and previous swing-high zone
3. Extended target (if momentum continues): $240 — strong resistance from the last consolidation before the drop
---
🛑 Stop-Loss Suggestion
Below the trendline or the Kumo support: around $198–200
(A clean break below this would invalidate the bullish setup.)
---
⚖ Trade Plan Summary
Type Entry Stop Target 1 Target 2 Risk:Reward
Long $204–206 $198 $212 $228–232 ~1:2.5–1:3
---
📈 Summary:
Trend = Bullish
Entry = On retest of $202–205 area
Target = $228–232
Stop = Below $198
トレード稼働中
trade active📲 Join telegram channel free .
t.me/addlist/dg3uSwzkMSplNjFk
Forex, Gold & Crypto Signals with detailed analysis & get consistent results.
t.me/+PNWQFM8CwnswYTc0
Gold Signal's with proper TP & SL for high profit opportunities.
t.me/addlist/dg3uSwzkMSplNjFk
Forex, Gold & Crypto Signals with detailed analysis & get consistent results.
t.me/+PNWQFM8CwnswYTc0
Gold Signal's with proper TP & SL for high profit opportunities.
関連の投稿
免責事項
この情報および投稿は、TradingViewが提供または推奨する金融、投資、トレード、その他のアドバイスや推奨を意図するものではなく、それらを構成するものでもありません。詳細は利用規約をご覧ください。
📲 Join telegram channel free .
t.me/addlist/dg3uSwzkMSplNjFk
Forex, Gold & Crypto Signals with detailed analysis & get consistent results.
t.me/+PNWQFM8CwnswYTc0
Gold Signal's with proper TP & SL for high profit opportunities.
t.me/addlist/dg3uSwzkMSplNjFk
Forex, Gold & Crypto Signals with detailed analysis & get consistent results.
t.me/+PNWQFM8CwnswYTc0
Gold Signal's with proper TP & SL for high profit opportunities.
関連の投稿
免責事項
この情報および投稿は、TradingViewが提供または推奨する金融、投資、トレード、その他のアドバイスや推奨を意図するものではなく、それらを構成するものでもありません。詳細は利用規約をご覧ください。