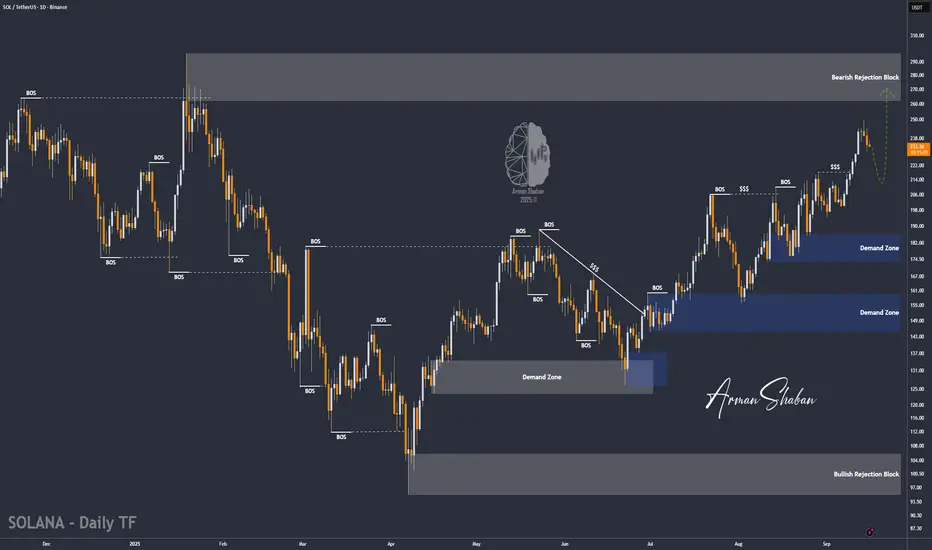
By analyzing the Solana chart on the daily timeframe, we can see that after a correction, the price is now trading around $234. In the short term, I expect a small pullback, followed by another strong bullish move from this coin.
The key demand zone is between $210–$220, while the possible upside targets are $250, $260, and $296.
Please support me with your likes and comments to motivate me to share more analysis with you and share your opinion about the possible trend of this chart with me !
Best Regards , Arman Shaban
The key demand zone is between $210–$220, while the possible upside targets are $250, $260, and $296.
Please support me with your likes and comments to motivate me to share more analysis with you and share your opinion about the possible trend of this chart with me !
Best Regards , Arman Shaban
トレード稼働中
By analyzing the Solana chart on the daily timeframe, we can see that the price is trading around $234. I expect a short correction here, followed by the start of the next bullish wave.The key demand zone is between $210–$220. If the price holds above $230, it could trigger the next bullish move, but for the uptrend to continue, a strong breakout above $250 is needed. The possible upside targets are $250, $260, and $296.
トレード終了: 利益確定目標に到達
Since the last analysis, Solana (SOL) has climbed to $248, gaining more than 7% in just one day. The bullish momentum remains very strong, showing buyers are still in control.As long as SOL holds above the $230 support zone, the trend points higher. The next key upside targets remain at $250, $260, and $296.
⚜️ Free TG Channel : t.me/PriceAction_ICT
⚜️ Contact for VIP : t.me/ArmanShabanTrading
🎉 The Best Crypto Exchange ($100 Bonus) : lbank.com/ref/4Y77P
✅ One of the Best Forex Brokers (Lirunex) : bit.ly/4oCawfH
⚜️ Contact for VIP : t.me/ArmanShabanTrading
🎉 The Best Crypto Exchange ($100 Bonus) : lbank.com/ref/4Y77P
✅ One of the Best Forex Brokers (Lirunex) : bit.ly/4oCawfH
関連の投稿
免責事項
これらの情報および投稿は、TradingViewが提供または保証する金融、投資、取引、またはその他の種類のアドバイスや推奨を意図したものではなく、またそのようなものでもありません。詳しくは利用規約をご覧ください。