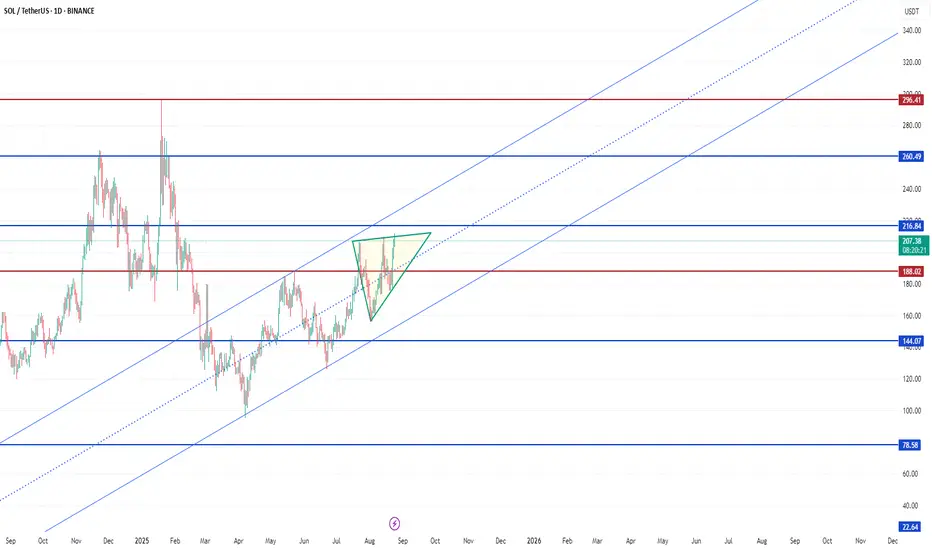
The bar chart is in a mid-upward trend, having started in April 2025 and continued up to the present. Now, the chart is trapped in a triangle for a month. The future trend of the chart depends on the following break. If it can break above the triangle, and respectively exceed the resistance level, at $217, it would increase by $216 in the mid term.
On the other hand, the opposite scenario is a break below. In other words, the price might reduce to $144 if it breaks the support level, at $188, it is a crucial level because of the juncture of the bottom of the triangle, and $188 support level.
To sum up, there are two ways, an increase or a decrease, for SOLANA, and it generally depends on the first break will occur up or down.
免責事項
この情報および投稿は、TradingViewが提供または推奨する金融、投資、トレード、その他のアドバイスや推奨を意図するものではなく、それらを構成するものでもありません。詳細は利用規約をご覧ください。
免責事項
この情報および投稿は、TradingViewが提供または推奨する金融、投資、トレード、その他のアドバイスや推奨を意図するものではなく、それらを構成するものでもありません。詳細は利用規約をご覧ください。