SONACOMS – Falling Wedge Pattern Formation
Timeframe: Daily Chart
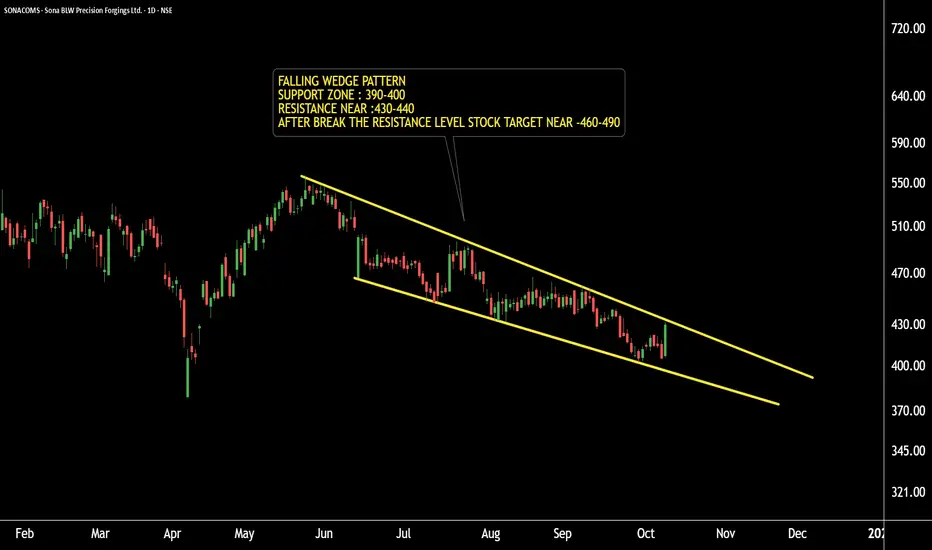
SONACOMS is forming a Falling Wedge pattern, which is a bullish reversal pattern in a bearish market phase.
The support zone is placed around ₹390–₹400 levels.
The resistance level is around ₹430.
A breakout above ₹430 may lead to pattern targets near ₹460 and ₹490.
If the support zone holds, we may witness higher prices in SONACOMS in the coming sessions.
Conclusion: Watch for a breakout confirmation for potential upside momentum.
Thank you !!
Timeframe: Daily Chart
SONACOMS is forming a Falling Wedge pattern, which is a bullish reversal pattern in a bearish market phase.
The support zone is placed around ₹390–₹400 levels.
The resistance level is around ₹430.
A breakout above ₹430 may lead to pattern targets near ₹460 and ₹490.
If the support zone holds, we may witness higher prices in SONACOMS in the coming sessions.
Conclusion: Watch for a breakout confirmation for potential upside momentum.
Thank you !!
@RahulSaraoge
Connect us at t.me/stridesadvisory
Connect us at t.me/stridesadvisory
免責事項
この情報および投稿は、TradingViewが提供または推奨する金融、投資、トレード、その他のアドバイスや推奨を意図するものではなく、それらを構成するものでもありません。詳細は利用規約をご覧ください。
@RahulSaraoge
Connect us at t.me/stridesadvisory
Connect us at t.me/stridesadvisory
免責事項
この情報および投稿は、TradingViewが提供または推奨する金融、投資、トレード、その他のアドバイスや推奨を意図するものではなく、それらを構成するものでもありません。詳細は利用規約をご覧ください。