SPWL is most probably in wave C or 3
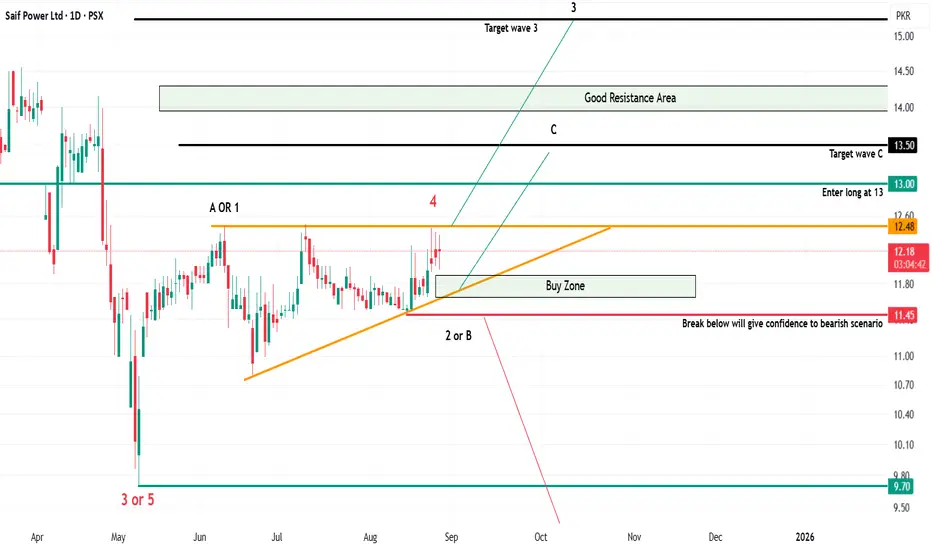
Our preferred wave count suggests that we are in wave C or 3 which will take price toward 13.50 or 15.25.
If this unfolds as wave C, then price will retest the below orange trendline support (11.80 - 11.60 area) giving an excellent opportunity for long position targeting 13.50 area.
On the other hand if this unfolds as wave 3 then its very unlikely that prices will go down toward the buy zone, instead prices will rise directly targeting 15.25 area (the rise should be a sharp one)
Alternate wave count suggest that wave 4 (marked in red) has just completed and wave 5 has started which will take price down towards 9.70 and lower.
We will take trade if price touches the below orange trendline (11.80 - 11.60 area) or once the price break above 13 level.
Trade Setup:
Entry level: 11.80 - 11.60 or 13
Stop loss: 11.45
Target:
13.50 (if price go down toward 11.80 - 11.60)
15.25 (if price rise directly breaking above 13)
Let see how this plays, Good Luck!
Disclaimer: The information presented in this wave analysis is intended solely for educational and informational purposes. It does not constitute financial or trading advice, nor should it be interpreted as a recommendation to buy or sell any securities.
トレード終了: ストップロスに到達
Our trade got active and hit stop loss within a short span. If our alternate wave is correct then price will go below 9.70.Entry price: 11.68
Exit price: 11.45
Loss @ share: 0.23
Gross loss: 1.97%
ノート
Price has been falling nicely as anticipated, now price should go below 9.70 from where we will start accumulating some positions. Will post the idea once a suitable buy setup gets confirmed.免責事項
この情報および投稿は、TradingViewが提供または推奨する金融、投資、トレード、その他のアドバイスや推奨を意図するものではなく、それらを構成するものでもありません。詳細は利用規約をご覧ください。
免責事項
この情報および投稿は、TradingViewが提供または推奨する金融、投資、トレード、その他のアドバイスや推奨を意図するものではなく、それらを構成するものでもありません。詳細は利用規約をご覧ください。