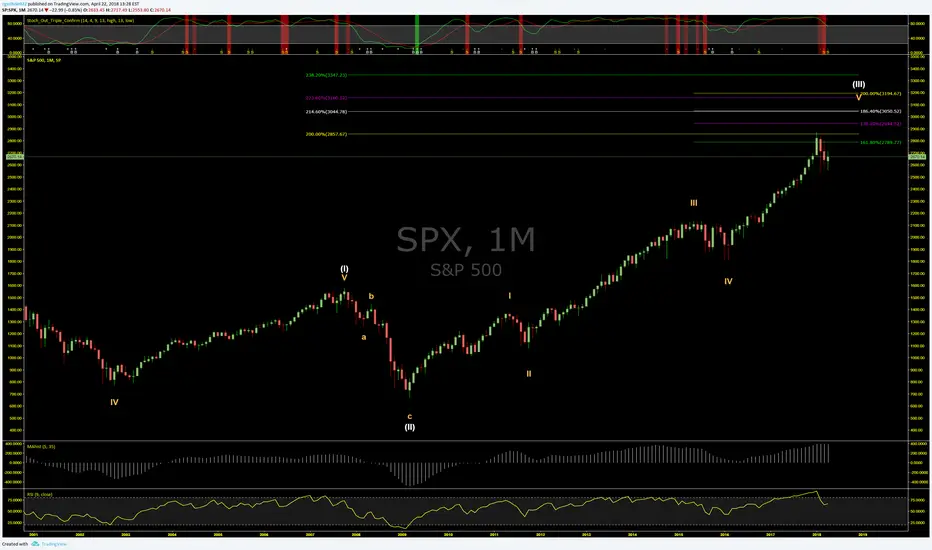
Based on my analysis of the Elliott wave that began around 1993, we are coming to the top of the third SuperCycle wave. SyperCycle Wave 1 ended with the market top in 2007 prior to the popping of the housing bubble. SyperCycle Wave 2 ended at the bottom in 2009 and we have been in SyperCycle Wave 3 ever since.
I project the market top to occur between November 1 and December 31 this year (2018). The good news is my projected level is 18% higher than where we are now. My market top for the S & P 500 is between 3160.12 and 3194.67. Based on this timeframe, I wonder if the real world catalyst rekates to the North Korean peninsula matters, surprise in 2018 mid-term elections or some other event.
I encourage other Wave Analysts to share your thoughts.
All forecasts are based on analysis of past behavior. Prior movements are not always indicative of future movement. Develop the theory, test the theory. Do your own research. Nothing in this analysis constitutes advice. YouTube For More. Good luck!!
免責事項
これらの情報および投稿は、TradingViewが提供または保証する金融、投資、取引、またはその他の種類のアドバイスや推奨を意図したものではなく、またそのようなものでもありません。詳しくは利用規約をご覧ください。