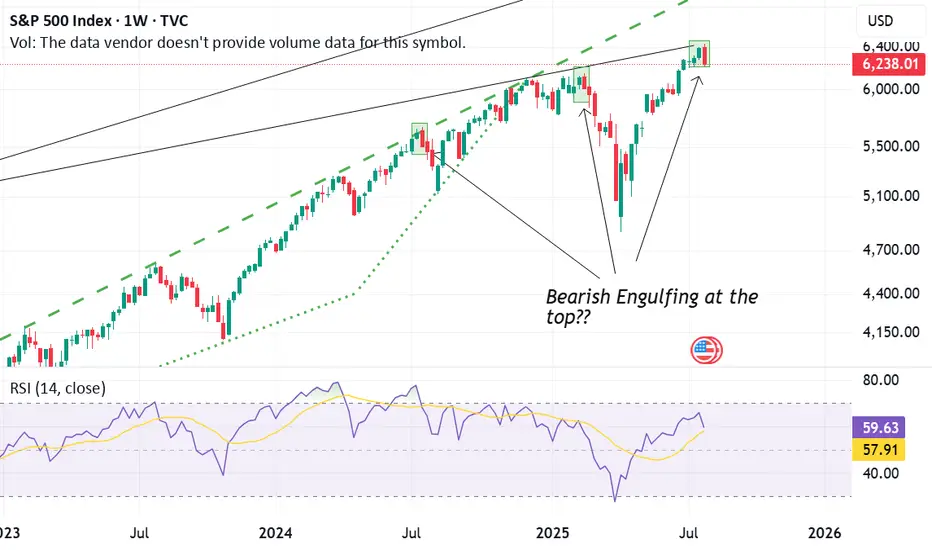
Last week, the S&P 500 Index (SPX) printed a bearish engulfing candle on the weekly chart. This candlestick pattern occurs when a larger red (bearish) candle completely "engulfs" the body of the previous green (bullish) candle. It is a classic reversal signal, often indicating that the momentum may be shifting from bullish to bearish.
What makes this significant is the recurring pattern we've observed:
At each of the last three market tops, the SPX formed a bearish engulfing pattern—and each time, this was followed by a notable correction or pullback.
The current candle mirrors those past setups almost identically, suggesting that the market may again be vulnerable to a short-term decline.
However, the big question remains:
"Will this time be different?"
In short, the bearish engulfing pattern is a warning sign—especially given its historical reliability at tops—but confirmation is key.
Ask ChatGPT
ノート
Confirmation did not come next week that negates the downside view...Apologies for the late update免責事項
これらの情報および投稿は、TradingViewが提供または保証する金融、投資、取引、またはその他の種類のアドバイスや推奨を意図したものではなく、またそのようなものでもありません。詳しくは利用規約をご覧ください。
免責事項
これらの情報および投稿は、TradingViewが提供または保証する金融、投資、取引、またはその他の種類のアドバイスや推奨を意図したものではなく、またそのようなものでもありません。詳しくは利用規約をご覧ください。