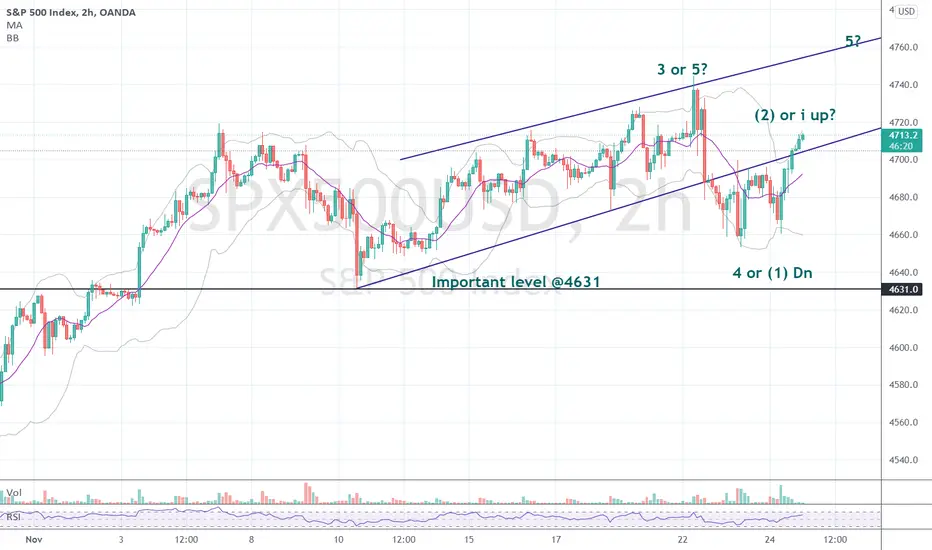
Long held trends tend to hold-up, well... long. I've labeled the chart with 2 of what I think are the most plausible EW count scenarios. It does allow to see where the risk and acceleration levels likely are. Only time will tell if the top is in, or if we are going still higher yet.
トレード稼働中
At time of writing the SPX500 has dropped substantially. So the bear market count comes into play. Have said that the current shape of the downturn could also be interpreted as an ABC and the correction could end soon. The next few trading days will clear up the picture.免責事項
これらの情報および投稿は、TradingViewが提供または保証する金融、投資、取引、またはその他の種類のアドバイスや推奨を意図したものではなく、またそのようなものでもありません。詳しくは利用規約をご覧ください。
免責事項
これらの情報および投稿は、TradingViewが提供または保証する金融、投資、取引、またはその他の種類のアドバイスや推奨を意図したものではなく、またそのようなものでもありません。詳しくは利用規約をご覧ください。