SPY Friday Setup – Bears Take Control Below $662 as Gamma Turns Negative ⚠️”
📊 Multi-Timeframe Breakdown
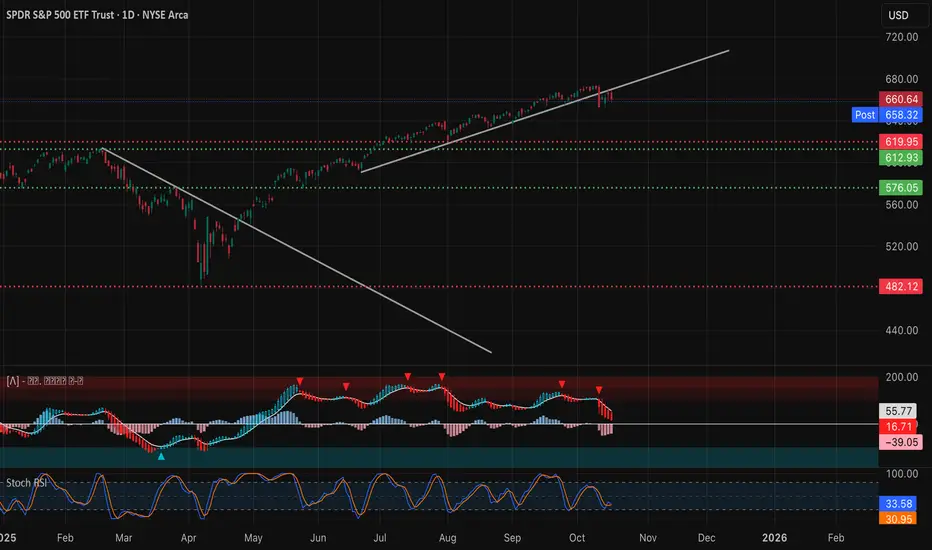
🕒 1. Daily Chart – Macro Structure (“The Why”)
SPY continues to lose grip at the upper trend channel, printing its third consecutive red daily candle and officially breaking below the short-term rising trendline that’s guided price since April. The breakdown below $662–$665 confirms a near-term shift in momentum from bullish to neutral-bearish.
MACD shows a clear bearish crossover, with histogram momentum building to the downside. Stoch RSI sits near the lower band, but not yet oversold — implying more room for a grind-down before a proper bounce.
Macro Bias: Momentum fading; corrective wave likely unfolding toward key supports at $650 → $620 unless bulls reclaim $665.
Key Levels:
* Resistance: $662 → $670 → $682
* Support: $658 → $650 → $620
⏰ 2. 1-Hour Chart – Active Market Structure (“The Setup”)

The 1H structure highlights a CHoCH confirmation near $662, with a decisive BOS to the downside that opened a new lower-low pattern. Price retested the underside of the broken channel around $662–$664, rejected cleanly, and now trades below the intraday trendline — a bearish continuation setup.
MACD remains deep in negative territory, while Stoch RSI has reset near zero, suggesting sellers still control short-term momentum. A recovery into $662–$664 may offer a fade setup if buyers fail to break above that zone with volume.
Key Levels:
* Resistance: $662 → $665 → $670
* Support: $655 → $650 → $645
💹 3. 15-Minute Chart – Intraday Execution (“The How”)

On the 15-minute timeframe, SPY shows a tight descending channel with multiple CHoCH → BOS prints confirming lower-high structure. The MACD histogram has slightly flattened near zero, indicating short-term indecision after extended downside. Meanwhile, Stoch RSI is curling upward from oversold — suggesting a brief relief bounce before sellers step in again.
If price holds below $662, every rally into $660–$663 remains a short opportunity zone.
Scalp Plan:
* Bearish Scenario: Enter below $658, target $654 → $650, stop above $662.5
* Bullish Scenario: Flip long only on confirmed reclaim above $665, target $670, stop below $661
Volume spikes show heavy positioning around $660 — a battle zone likely to dictate the next leg.
📈 4. GEX (Gamma Exposure) Chart – Dealer Positioning (“The Fuel”)

Gamma flow data shows a bearish dealer setup, with highest negative NETGEX and PUT support now anchored near $660. Dealers are short gamma — meaning volatility expansion can accelerate in either direction, but the bias is currently to the downside.
* Gamma Flip Zone: $662
* Highest Negative GEX / Put Wall: $660 (active support magnet)
* Second Put Wall: $656 → $654
* Call Resistance: $662 → $665
* IVR: 36.3 | IVx avg: 24.3 | Put flow: 145.1% dominant
The gamma structure implies dealers are hedging aggressively below $660, which can amplify intraday drops if $658 fails. Until SPY reclaims $662+, market makers’ hedging flows remain bearish.
🎯 Final Outlook
SPY’s technical structure and gamma setup both favor a bearish-to-neutral bias heading into Friday. The key battleground sits between $658–$662 — a zone where intraday liquidity repeatedly flips.
If $662 holds as resistance, expect continued downside toward $654–$650, where gamma exposure may stabilize. A sharp reclaim of $665 would invalidate the short setup and shift sentiment back toward range recovery.
Watch for a fake breakout above $662 early Friday followed by rejection — a classic “trap and drop” scenario that aligns with the current gamma map.
Disclaimer: This analysis is for educational purposes only and not financial advice. Always do your own research and manage your risk carefully.
📊 Multi-Timeframe Breakdown
🕒 1. Daily Chart – Macro Structure (“The Why”)
SPY continues to lose grip at the upper trend channel, printing its third consecutive red daily candle and officially breaking below the short-term rising trendline that’s guided price since April. The breakdown below $662–$665 confirms a near-term shift in momentum from bullish to neutral-bearish.
MACD shows a clear bearish crossover, with histogram momentum building to the downside. Stoch RSI sits near the lower band, but not yet oversold — implying more room for a grind-down before a proper bounce.
Macro Bias: Momentum fading; corrective wave likely unfolding toward key supports at $650 → $620 unless bulls reclaim $665.
Key Levels:
* Resistance: $662 → $670 → $682
* Support: $658 → $650 → $620
⏰ 2. 1-Hour Chart – Active Market Structure (“The Setup”)
The 1H structure highlights a CHoCH confirmation near $662, with a decisive BOS to the downside that opened a new lower-low pattern. Price retested the underside of the broken channel around $662–$664, rejected cleanly, and now trades below the intraday trendline — a bearish continuation setup.
MACD remains deep in negative territory, while Stoch RSI has reset near zero, suggesting sellers still control short-term momentum. A recovery into $662–$664 may offer a fade setup if buyers fail to break above that zone with volume.
Key Levels:
* Resistance: $662 → $665 → $670
* Support: $655 → $650 → $645
💹 3. 15-Minute Chart – Intraday Execution (“The How”)
On the 15-minute timeframe, SPY shows a tight descending channel with multiple CHoCH → BOS prints confirming lower-high structure. The MACD histogram has slightly flattened near zero, indicating short-term indecision after extended downside. Meanwhile, Stoch RSI is curling upward from oversold — suggesting a brief relief bounce before sellers step in again.
If price holds below $662, every rally into $660–$663 remains a short opportunity zone.
Scalp Plan:
* Bearish Scenario: Enter below $658, target $654 → $650, stop above $662.5
* Bullish Scenario: Flip long only on confirmed reclaim above $665, target $670, stop below $661
Volume spikes show heavy positioning around $660 — a battle zone likely to dictate the next leg.
📈 4. GEX (Gamma Exposure) Chart – Dealer Positioning (“The Fuel”)
Gamma flow data shows a bearish dealer setup, with highest negative NETGEX and PUT support now anchored near $660. Dealers are short gamma — meaning volatility expansion can accelerate in either direction, but the bias is currently to the downside.
* Gamma Flip Zone: $662
* Highest Negative GEX / Put Wall: $660 (active support magnet)
* Second Put Wall: $656 → $654
* Call Resistance: $662 → $665
* IVR: 36.3 | IVx avg: 24.3 | Put flow: 145.1% dominant
The gamma structure implies dealers are hedging aggressively below $660, which can amplify intraday drops if $658 fails. Until SPY reclaims $662+, market makers’ hedging flows remain bearish.
🎯 Final Outlook
SPY’s technical structure and gamma setup both favor a bearish-to-neutral bias heading into Friday. The key battleground sits between $658–$662 — a zone where intraday liquidity repeatedly flips.
If $662 holds as resistance, expect continued downside toward $654–$650, where gamma exposure may stabilize. A sharp reclaim of $665 would invalidate the short setup and shift sentiment back toward range recovery.
Watch for a fake breakout above $662 early Friday followed by rejection — a classic “trap and drop” scenario that aligns with the current gamma map.
Disclaimer: This analysis is for educational purposes only and not financial advice. Always do your own research and manage your risk carefully.
免責事項
この情報および投稿は、TradingViewが提供または推奨する金融、投資、トレード、その他のアドバイスや推奨を意図するものではなく、それらを構成するものでもありません。詳細は利用規約をご覧ください。
免責事項
この情報および投稿は、TradingViewが提供または推奨する金融、投資、トレード、その他のアドバイスや推奨を意図するものではなく、それらを構成するものでもありません。詳細は利用規約をご覧ください。