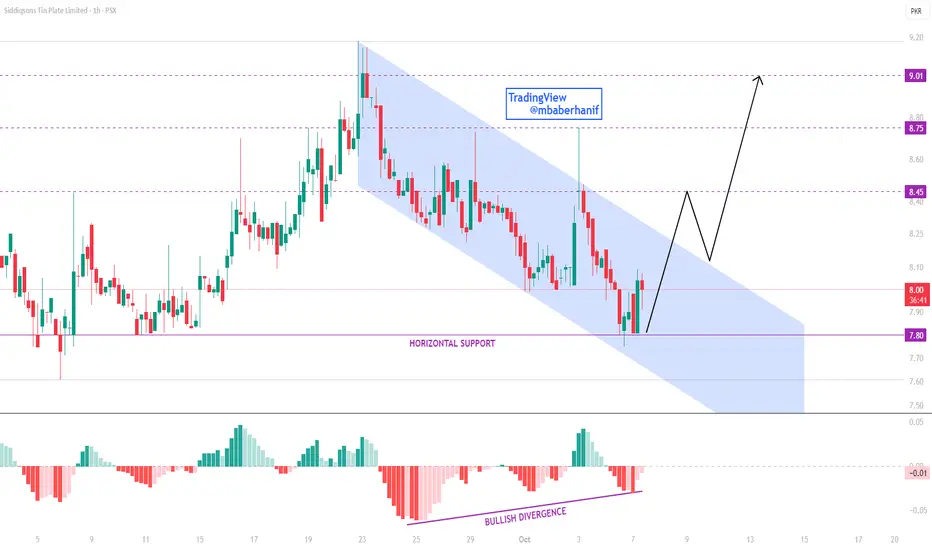
STPL is showing signs of a potential reversal as the price pulls back from the horizontal support around 7.80, simultaneously touching the lower boundary of the descending parallel channel. A bullish divergence is visible on the MACD histogram, indicating that selling momentum is weakening and buyers are likely to regain control.
If the price successfully breaks above the parallel channel, it could trigger the next bullish wave. Upside targets are set at 8.45, 8.75, and 9.01, respectively.
If the price successfully breaks above the parallel channel, it could trigger the next bullish wave. Upside targets are set at 8.45, 8.75, and 9.01, respectively.
トレード終了: 利益確定目標に到達
免責事項
この情報および投稿は、TradingViewが提供または推奨する金融、投資、トレード、その他のアドバイスや推奨を意図するものではなく、それらを構成するものでもありません。詳細は利用規約をご覧ください。
免責事項
この情報および投稿は、TradingViewが提供または推奨する金融、投資、トレード、その他のアドバイスや推奨を意図するものではなく、それらを構成するものでもありません。詳細は利用規約をご覧ください。