Note : This is only a chart analysis and for study purposes. Not a recommendation to buy or sell.
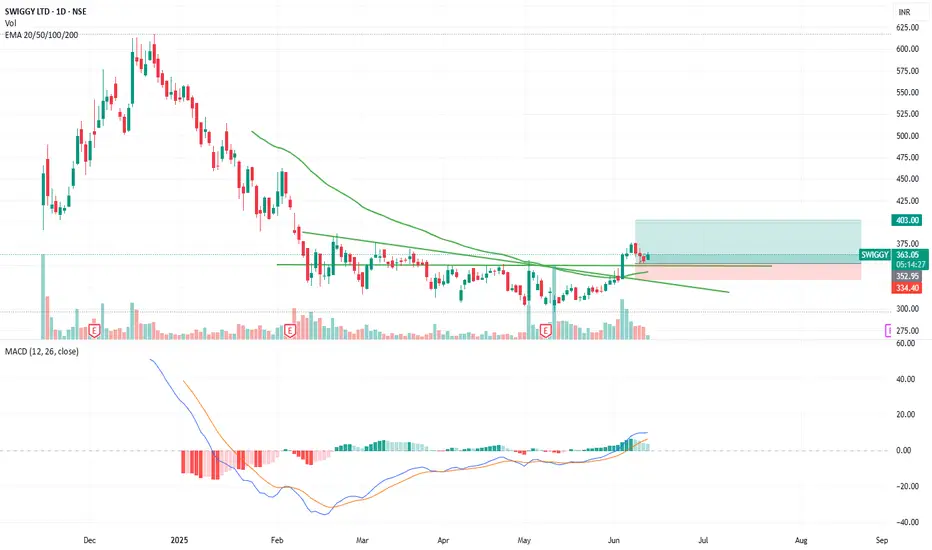
Chart Analysis Summary:
Breakout Zone:
The stock has clearly broken above a descending trendline that acted as resistance for several months. The breakout was supported by a strong bullish candle with notable volume, indicating genuine buying interest.
Volume:
The breakout candle shows a volume spike, validating the move. Volume continues to remain stable post-breakout, supporting the sustainability of the trend.
Retest Confirmation:
After the breakout, SWIGGY came back to retest the breakout zone (~345-350) and formed a bullish reversal, confirming the support zone.
Current Price Action:
Price is now moving higher again, suggesting the end of the retest phase and a potential beginning of a fresh uptrend.
EMA Analysis:
Price is trading above the 20/50/100/200 EMA cluster (currently near 339.25), which was earlier acting as a dynamic resistance and now may serve as support.
MACD:
MACD crossover above the signal line is visible and trending upward – a bullish momentum signal.
関連の投稿
免責事項
この情報および投稿は、TradingViewが提供または推奨する金融、投資、トレード、その他のアドバイスや推奨を意図するものではなく、それらを構成するものでもありません。詳細は利用規約をご覧ください。
免責事項
この情報および投稿は、TradingViewが提供または推奨する金融、投資、トレード、その他のアドバイスや推奨を意図するものではなく、それらを構成するものでもありません。詳細は利用規約をご覧ください。