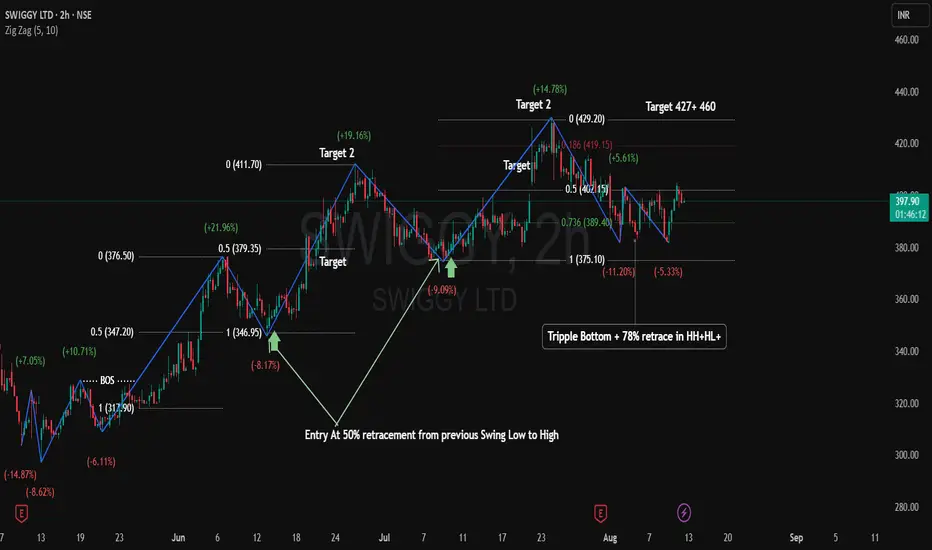
Based on the ICT trading method, the Swiggy chart is currently showing a Higher High (HH) and Higher Low (HL) structure. The first two counter-trend moves retraced 50% from the previous swing high to the recent swing low, providing excellent opportunities for optimal trend entries.
At present, the price is at 403, which marks a Break of Structure (BOS) on the chart, with a primary target of 427. If the rally continues, the trend could extend toward 460 as per projections. The stop-loss is set at 379 (recent low + buffer).
In the ICT method, the target is typically set at the previous swing high, as reflected in this chart. This strategy focuses on entering trades at the end of a counter-trend, offering low-risk entries with favorable risk-reward ratios.
Disclaimer: lnkd.in/gJJDnvn2
免責事項
この情報および投稿は、TradingViewが提供または推奨する金融、投資、トレード、その他のアドバイスや推奨を意図するものではなく、それらを構成するものでもありません。詳細は利用規約をご覧ください。
免責事項
この情報および投稿は、TradingViewが提供または推奨する金融、投資、トレード、その他のアドバイスや推奨を意図するものではなく、それらを構成するものでもありません。詳細は利用規約をご覧ください。