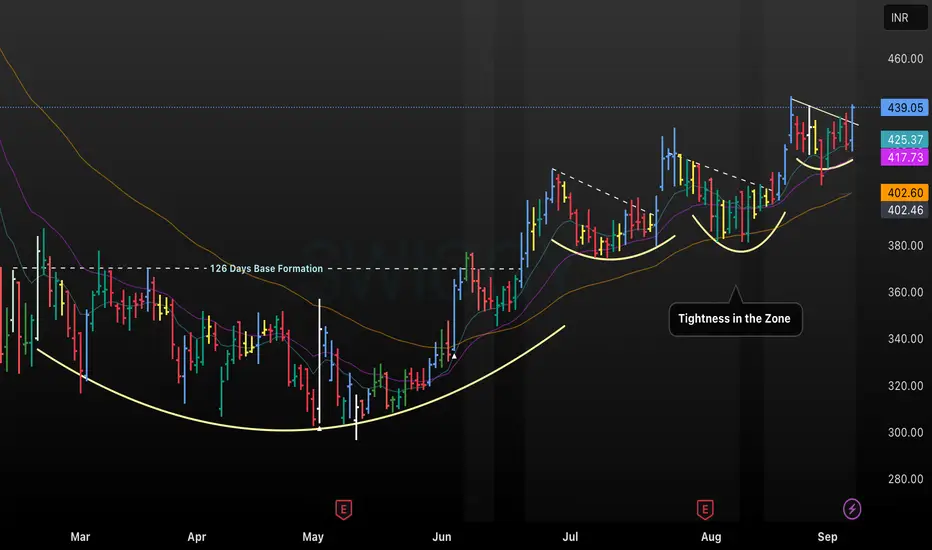
This chart analyzes SWIGGY’s recent price action and technical setup, featuring a 126-day base formation as a foundation for trend reversal and bullish momentum. The stock has shown consistent upward movement, supported by tightening in the zone and well-defined moving average support, with resistance levels around 439.05 INR. Tightness in the trend zone indicates buyer accumulation, increasing the probability of a sustained breakout following the consolidation phase and moving average alignment
免責事項
この情報および投稿は、TradingViewが提供または推奨する金融、投資、トレード、その他のアドバイスや推奨を意図するものではなく、それらを構成するものでもありません。詳細は利用規約をご覧ください。
免責事項
この情報および投稿は、TradingViewが提供または推奨する金融、投資、トレード、その他のアドバイスや推奨を意図するものではなく、それらを構成するものでもありません。詳細は利用規約をご覧ください。