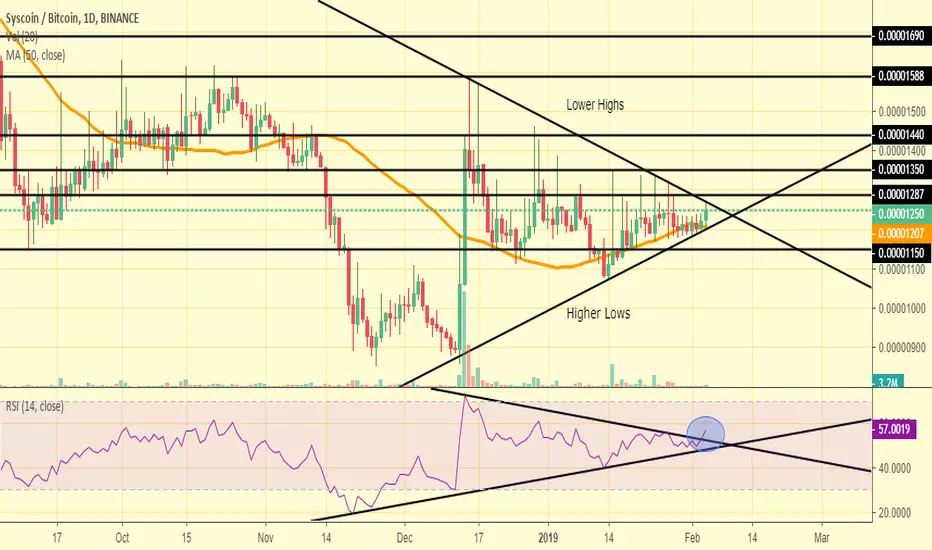
There is a perfect symmetrical triangle for SYS and ready to breakout.
Daily RSI seems to breakout the downtrend. MA50 is a good support.
Possible targets and resistances are being shown on the chart.
Daily RSI seems to breakout the downtrend. MA50 is a good support.
Possible targets and resistances are being shown on the chart.
免責事項
これらの情報および投稿は、TradingViewが提供または保証する金融、投資、取引、またはその他の種類のアドバイスや推奨を意図したものではなく、またそのようなものでもありません。詳しくは利用規約をご覧ください。
免責事項
これらの情報および投稿は、TradingViewが提供または保証する金融、投資、取引、またはその他の種類のアドバイスや推奨を意図したものではなく、またそのようなものでもありません。詳しくは利用規約をご覧ください。