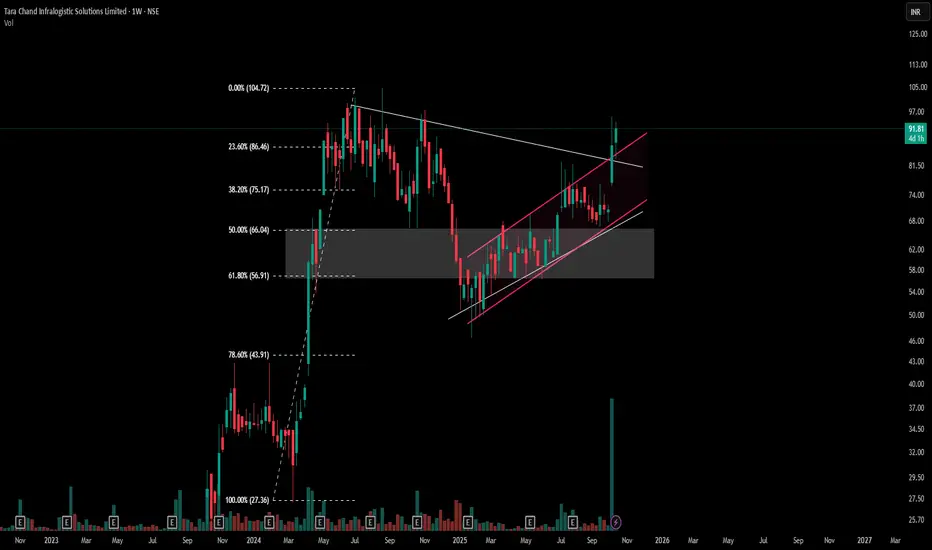
This weekly chart of Tara Chand Infralogistic Solutions Ltd. serves as a case study in identifying and analyzing overlapping price action structures in 3 Main Points -
1) The chart highlights a well-defined symmetrical triangle pattern, with one white line representing the counter-trendline (CT) and another as the primary trendline (T), illustrating the process of volatility contraction.
2) Overlaid within the triangle, a clearly marked parallel channel (in pink) frames the intermediate price swings during the recent consolidation. The channel illustrates rotational movement within the broader consolidation envelope, mapping the climb and retracement cycles more granularly.
3) Volume, Fibonacci retracement levels, and the shaded value area further reinforce the chart’s impartial focus on structure, without implying directionality. This example serves as a valuable reference for recognizing multi-pattern contexts and appreciating how classical patterns—when viewed together—help decode complex phases of price organization.
- Disclaimer: Trading involves significant risk and is not suitable for all investors. Past performance does not guarantee future results. Always conduct your own research, consider seeking advice from a qualified financial advisor, and trade only with capital you can afford to lose.
🎯 Master My Self-Made Trading Strategy
📈 Telegram (Learn Today): t.me/hashtaghammer
✅ WhatsApp (Learn Today): wa.me/919455664601
📈 Telegram (Learn Today): t.me/hashtaghammer
✅ WhatsApp (Learn Today): wa.me/919455664601
関連の投稿
免責事項
この情報および投稿は、TradingViewが提供または推奨する金融、投資、トレード、その他のアドバイスや推奨を意図するものではなく、それらを構成するものでもありません。詳細は利用規約をご覧ください。