📈 Daily Support & Resistance Levels
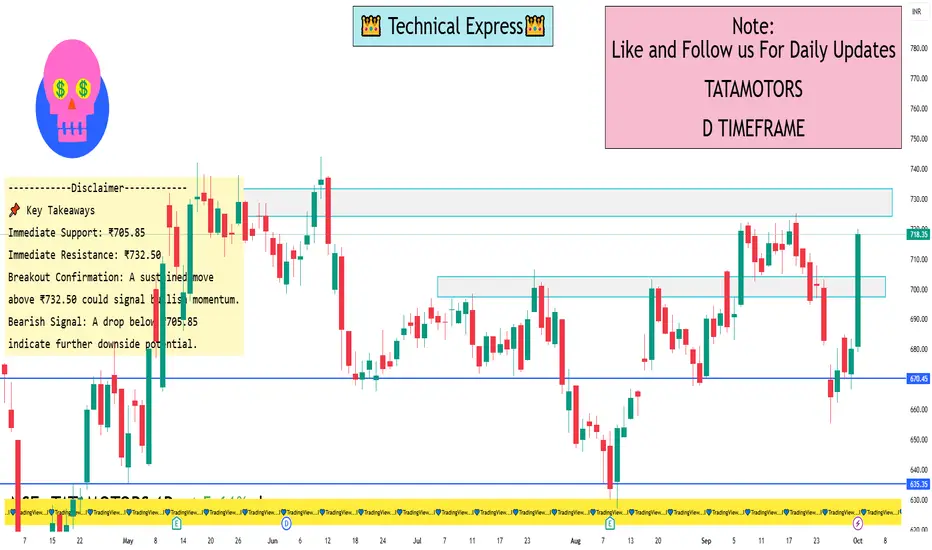
Immediate Support: ₹705.85
Immediate Resistance: ₹732.50
Pivot Point: ₹705.85
These levels are derived from the Classic Pivot Point analysis, indicating that the stock is trading near its pivot point, suggesting a neutral bias with potential for breakout or pullback depending on market momentum.
🔁 Fibonacci Retracement Levels
Key Support Levels:
23.6%: ₹694.85
38.2%: ₹664.45
50%: ₹639.88
61.8%: ₹615.30
Key Resistance Levels:
23.6%: ₹767.50
38.2%: ₹797.90
50%: ₹822.47
61.8%: ₹847.05
These Fibonacci levels provide potential support and resistance zones, useful for identifying entry and exit points.
📉 Technical Indicators
Relative Strength Index (RSI): Approximately 42.6, indicating early bullish momentum.
Moving Averages: The stock is trading below its 5-day and 13-day moving averages, suggesting a bearish trend.
🧭 Trend Analysis
The stock is currently trading near its pivot point, indicating a neutral bias. A breakout above ₹732.50 could signal bullish momentum, while a drop below ₹705.85 may indicate further downside potential.
📌 Key Takeaways
Immediate Support: ₹705.85
Immediate Resistance: ₹732.50
Breakout Confirmation: A sustained move above ₹732.50 could signal bullish momentum.
Bearish Signal: A drop below ₹705.85 may indicate further downside potential.
Immediate Support: ₹705.85
Immediate Resistance: ₹732.50
Pivot Point: ₹705.85
These levels are derived from the Classic Pivot Point analysis, indicating that the stock is trading near its pivot point, suggesting a neutral bias with potential for breakout or pullback depending on market momentum.
🔁 Fibonacci Retracement Levels
Key Support Levels:
23.6%: ₹694.85
38.2%: ₹664.45
50%: ₹639.88
61.8%: ₹615.30
Key Resistance Levels:
23.6%: ₹767.50
38.2%: ₹797.90
50%: ₹822.47
61.8%: ₹847.05
These Fibonacci levels provide potential support and resistance zones, useful for identifying entry and exit points.
📉 Technical Indicators
Relative Strength Index (RSI): Approximately 42.6, indicating early bullish momentum.
Moving Averages: The stock is trading below its 5-day and 13-day moving averages, suggesting a bearish trend.
🧭 Trend Analysis
The stock is currently trading near its pivot point, indicating a neutral bias. A breakout above ₹732.50 could signal bullish momentum, while a drop below ₹705.85 may indicate further downside potential.
📌 Key Takeaways
Immediate Support: ₹705.85
Immediate Resistance: ₹732.50
Breakout Confirmation: A sustained move above ₹732.50 could signal bullish momentum.
Bearish Signal: A drop below ₹705.85 may indicate further downside potential.
I built a Buy & Sell Signal Indicator with 85% accuracy.
📈 Get access via DM or
WhatsApp: wa.link/d997q0
Contact - +91 76782 40962
| Email: techncialexpress@gmail.com
| Script Coder | Trader | Investor | From India
📈 Get access via DM or
WhatsApp: wa.link/d997q0
Contact - +91 76782 40962
| Email: techncialexpress@gmail.com
| Script Coder | Trader | Investor | From India
関連の投稿
免責事項
この情報および投稿は、TradingViewが提供または推奨する金融、投資、トレード、その他のアドバイスや推奨を意図するものではなく、それらを構成するものでもありません。詳細は利用規約をご覧ください。