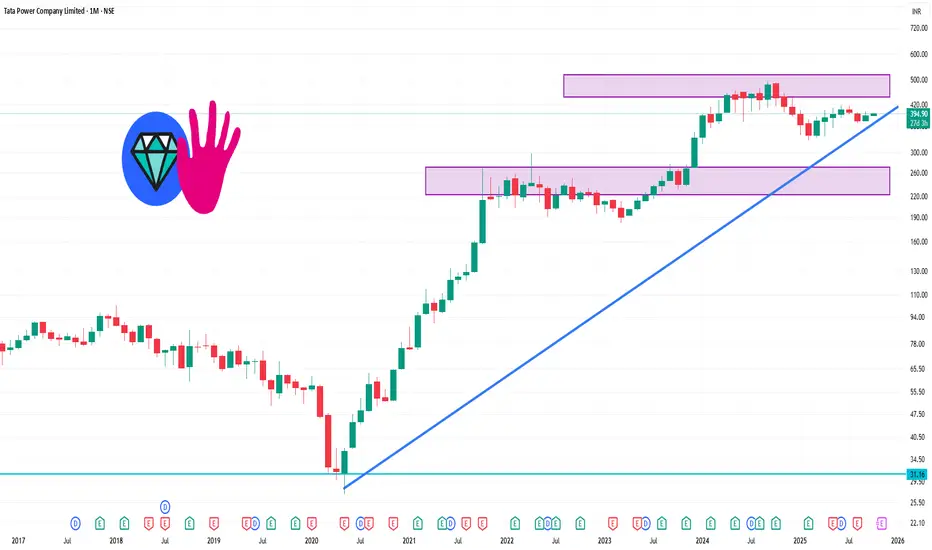
📊 1-Month Technical Overview
Over the past month, the stock has shown a modest upward movement of approximately 1.90%
TradingView
.
🔄 Pivot Points (Monthly)
Support Levels: ₹387.57, ₹375.23, ₹361.82
Resistance Levels: ₹413.32, ₹426.73, ₹440.14
The central pivot point stands at ₹400.98
📊 Technical Indicators
Relative Strength Index (RSI): 56.79 (Neutral)
Moving Average Convergence Divergence (MACD): 0.06 (Bullish)
Commodity Channel Index (CCI): -482.5 (Bullish)
Ultimate Oscillator: 80.16 (Bullish)
Simple Moving Averages (SMA): 20-day: ₹394.82, 50-day: ₹394.90, 200-day: ₹393.54 (All Bullish)
Exponential Moving Averages (EMA): 20-day: ₹394.92, 50-day: ₹394.79, 200-day: ₹393.68 (All Bullish)
🧠 Summary
Tata Power's stock is exhibiting a bullish trend over the past month, supported by positive technical indicators and sustained upward momentum. The current price is approaching key resistance levels, suggesting potential for further gains if these levels are breached. However, investors should remain cautious of broader market conditions and sector-specific challenges that could impact performance.
関連の投稿
免責事項
この情報および投稿は、TradingViewが提供または推奨する金融、投資、トレード、その他のアドバイスや推奨を意図するものではなく、それらを構成するものでもありません。詳細は利用規約をご覧ください。
関連の投稿
免責事項
この情報および投稿は、TradingViewが提供または推奨する金融、投資、トレード、その他のアドバイスや推奨を意図するものではなく、それらを構成するものでもありません。詳細は利用規約をご覧ください。