📊 1-Day Technical Analysis
📈 Support and Resistance Levels
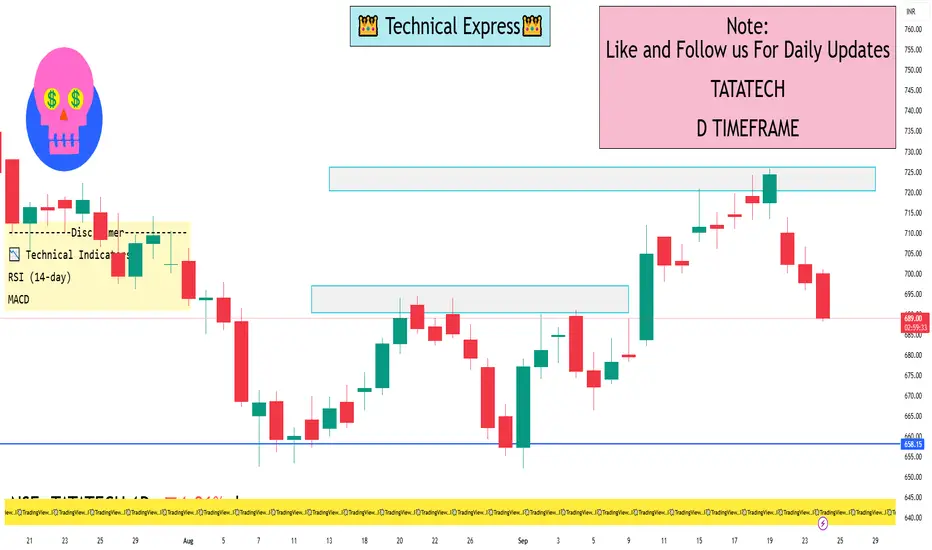
Immediate Support: ₹693.90
Immediate Resistance: ₹704.95
📉 Moving Averages
5-Day Moving Average: ₹696.90 (indicating a short-term bearish trend)
50-Day Moving Average: ₹710.72 (suggesting a bearish outlook)
200-Day Moving Average: ₹688.48 (indicating a long-term bullish trend)
📉 RSI (Relative Strength Index)
14-Day RSI: 33.53 (below 35, indicating an oversold condition and potential for a rebound)
📉 MACD (Moving Average Convergence Divergence)
MACD Value: -4.46 (below zero, confirming a bearish trend)
🔄 Overall Technical Indicators
Short-Term Outlook: Bearish
Medium-Term Outlook: Neutral
Long-Term Outlook: Bullish
🔮 Short-Term Forecast
The stock is expected to trade within a range of ₹690.89 to ₹704.61 on September 24, 2025, based on the 14-day Average True Range (ATR)
✅ Summary
Currently, Tata Technologies Ltd. exhibits a bearish short-term trend with potential for a rebound due to oversold conditions. Investors may consider monitoring for signs of stabilization or reversal before making trading decisions.
📈 Support and Resistance Levels
Immediate Support: ₹693.90
Immediate Resistance: ₹704.95
📉 Moving Averages
5-Day Moving Average: ₹696.90 (indicating a short-term bearish trend)
50-Day Moving Average: ₹710.72 (suggesting a bearish outlook)
200-Day Moving Average: ₹688.48 (indicating a long-term bullish trend)
📉 RSI (Relative Strength Index)
14-Day RSI: 33.53 (below 35, indicating an oversold condition and potential for a rebound)
📉 MACD (Moving Average Convergence Divergence)
MACD Value: -4.46 (below zero, confirming a bearish trend)
🔄 Overall Technical Indicators
Short-Term Outlook: Bearish
Medium-Term Outlook: Neutral
Long-Term Outlook: Bullish
🔮 Short-Term Forecast
The stock is expected to trade within a range of ₹690.89 to ₹704.61 on September 24, 2025, based on the 14-day Average True Range (ATR)
✅ Summary
Currently, Tata Technologies Ltd. exhibits a bearish short-term trend with potential for a rebound due to oversold conditions. Investors may consider monitoring for signs of stabilization or reversal before making trading decisions.
I built a Buy & Sell Signal Indicator with 85% accuracy.
📈 Get access via DM or
WhatsApp: wa.link/d997q0
Contact - +91 76782 40962
| Email: techncialexpress@gmail.com
| Script Coder | Trader | Investor | From India
📈 Get access via DM or
WhatsApp: wa.link/d997q0
Contact - +91 76782 40962
| Email: techncialexpress@gmail.com
| Script Coder | Trader | Investor | From India
関連の投稿
免責事項
この情報および投稿は、TradingViewが提供または推奨する金融、投資、トレード、その他のアドバイスや推奨を意図するものではなく、それらを構成するものでもありません。詳細は利用規約をご覧ください。