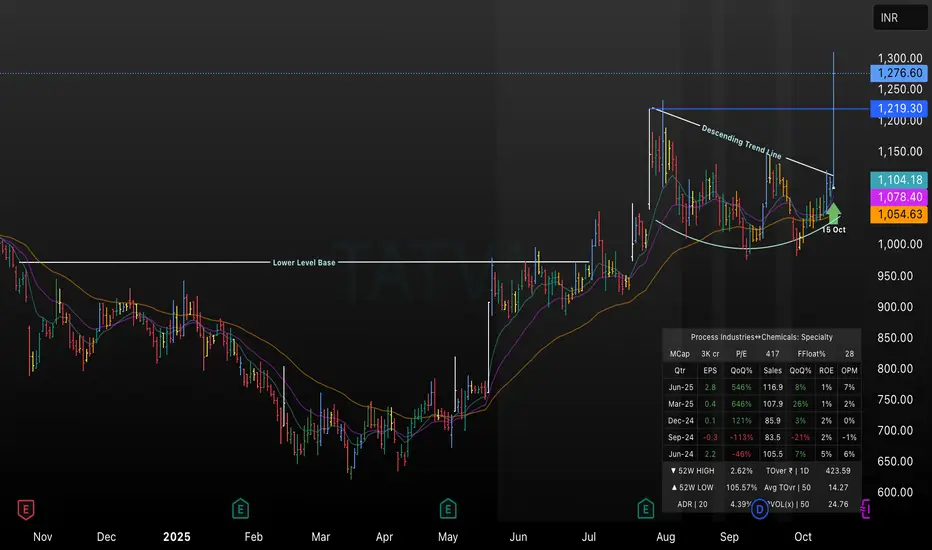
This TradingView chart highlights Tatva’s price action as it breaks above a descending trend line on October 15, 2025, signaling a strong bullish move. Key levels such as the lower base, breakout zone, and price targets (₹1219.30, ₹1276.60, ₹1300.00) are marked, with EMA indicators supporting positive momentum. The chart includes recent fundamentals, making it ideal for technical traders analyzing breakout setups and trend reversals in specialty chemicals stocks for Q4 2025
免責事項
これらの情報および投稿は、TradingViewが提供または保証する金融、投資、取引、またはその他の種類のアドバイスや推奨を意図したものではなく、またそのようなものでもありません。詳しくは利用規約をご覧ください。
免責事項
これらの情報および投稿は、TradingViewが提供または保証する金融、投資、取引、またはその他の種類のアドバイスや推奨を意図したものではなく、またそのようなものでもありません。詳しくは利用規約をご覧ください。