Topic Statement:
TCS has shown signs of recovery after a recent correction, with strong technical support levels reinforcing bullish potential.
Key Points:
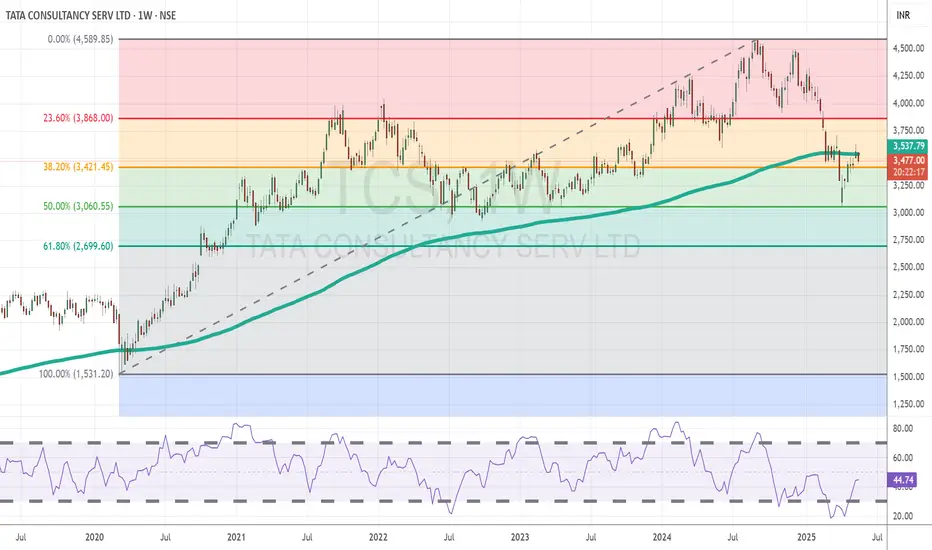
The price previously found strong and consistent support near the ₹3000 mark, reaffirmed during the recent market correction.
A full retracement to the 50% Fibonacci level** at ₹3060 attracted significant buying interest, highlighting renewed strength.
Currently, the stock trades just below the 200-day EMA, indicating it remains in oversold territory, but with potential for reversal if momentum continues.
TCS has shown signs of recovery after a recent correction, with strong technical support levels reinforcing bullish potential.
Key Points:
The price previously found strong and consistent support near the ₹3000 mark, reaffirmed during the recent market correction.
A full retracement to the 50% Fibonacci level** at ₹3060 attracted significant buying interest, highlighting renewed strength.
Currently, the stock trades just below the 200-day EMA, indicating it remains in oversold territory, but with potential for reversal if momentum continues.
免責事項
これらの情報および投稿は、TradingViewが提供または保証する金融、投資、取引、またはその他の種類のアドバイスや推奨を意図したものではなく、またそのようなものでもありません。詳しくは利用規約をご覧ください。
免責事項
これらの情報および投稿は、TradingViewが提供または保証する金融、投資、取引、またはその他の種類のアドバイスや推奨を意図したものではなく、またそのようなものでもありません。詳しくは利用規約をご覧ください。