As of April 29, 2025, here are the key support and resistance levels for Tourism Finance Corporation of India Ltd. (TFCILTD) based on recent technical analyses:
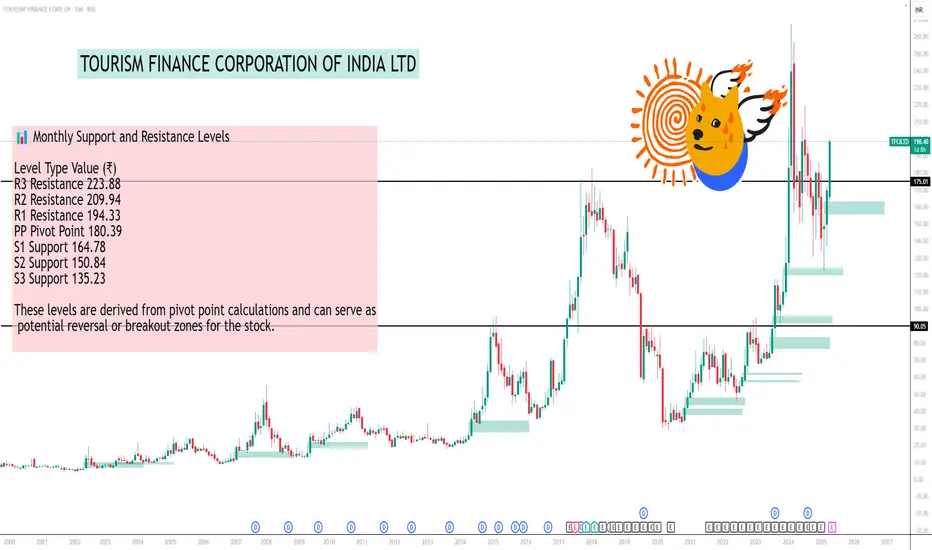
📊 Monthly Support and Resistance Levels
Level Type Value (₹)
R3 Resistance 223.88
R2 Resistance 209.94
R1 Resistance 194.33
PP Pivot Point 180.39
S1 Support 164.78
S2 Support 150.84
S3 Support 135.23
These levels are derived from pivot point calculations and can serve as potential reversal or breakout zones for the stock.
📈 Additional Technical Indicators
Relative Strength Index (RSI): 56.41, indicating a neutral to slightly bullish momentum.
Moving Averages:
20-Day SMA: ₹137.90
50-Day SMA: ₹152.87
関連の投稿
免責事項
これらの情報および投稿は、TradingViewが提供または保証する金融、投資、取引、またはその他の種類のアドバイスや推奨を意図したものではなく、またそのようなものでもありません。詳しくは利用規約をご覧ください。
関連の投稿
免責事項
これらの情報および投稿は、TradingViewが提供または保証する金融、投資、取引、またはその他の種類のアドバイスや推奨を意図したものではなく、またそのようなものでもありません。詳しくは利用規約をご覧ください。